The Beginner’s Guide to Chrome Developer Tools
Chrome Developer Tools is a comprehensive toolkit for developers, built directly into the Chrome browser. These tools let you edit web pages in real time, diagnose problems more quickly, and build better websites faster.
Even if you’re not a developer, though, you can still get some use out of Developer Tools.
What are Chrome Developer Tools?
Here’s what you’ll see when you open Developer Tools:
A standard web page, but with a new set of tools open in a panel on the right of the page.
There are three tabs at the top of the Developer Tools window, and a further six that you can see by clicking the >> symbol next to them.
The tabs are:
- Elements
- Console
- Source
- Network
- Application
- Security
- Memory
- Performance
- Audits
They don’t always stay in this order—Chrome moves them around based on which you opened last.
By default, Developer Tools opens with the Elements tab open.
Elements shows you the HTML used to build the page you’re looking at, together with any inline CSS.
Console deals with JavaScript. It gives you information about interactive elements on a page. In Console, you can write JavaScript to interact with the web page you’re viewing, and it also lets you write messages to yourself in the JavaScript of websites you’re building, which then show up in Console to show that the JS was executed.
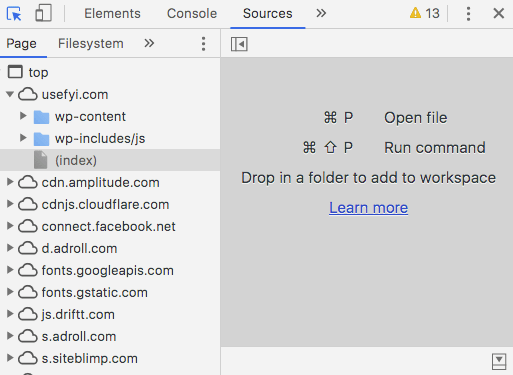
The Sources tab shows you where all the files that were used to make the website are stored and lets you inspect them.
The Network tab shows you all the files that are loading in the URL you’re looking at.
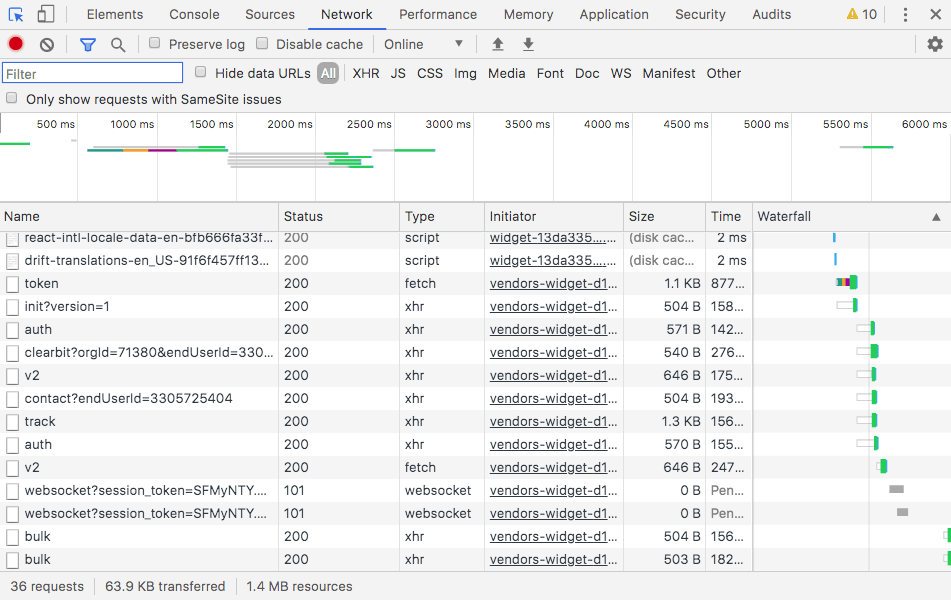
You get a waterfall and deep data on all the items loaded, including initiator and time to load that element.
Application shows you what’s in your browser storage: in-browser databases like Web SQL, local storage, and more. It also gives you granular control over your cookies.
Security gives you basic security information, letting you view a site’s HTTPS certificate and TLS status.
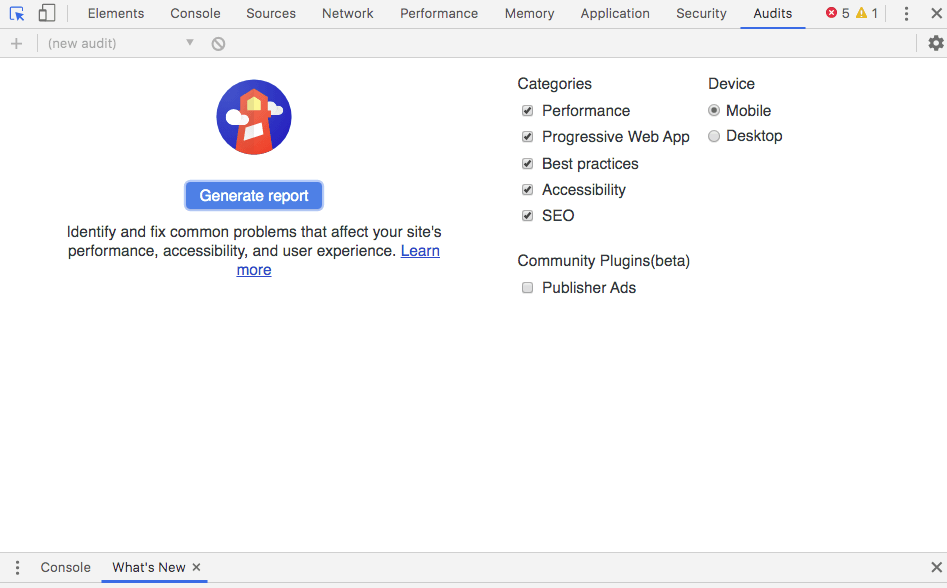
Finally, there’s Audits, which autogenerates reports on site functionality and structure to help developers improve performance.
Developer Tools is updated with each new Chrome release. To make sure they’re up-to-date, go to Components by typing chrome://components into your omnibar, select “Recovery” and check for updates.
Important: You can’t change the code on the website with Developer Tools. You’d need access to the site’s backend for that. Only the code your browser uses to display the website is changed. So even if you’re a total beginner, you can do anything you like with Developer Tools with no real risk. Close the window, go back to the website, and everything is the same as it was before.
Let’s start using Developer Tools.
How to open Chrome Developer Tools
You can open Developer Tools with keyboard shortcuts or through the Chrome menu.
The keyboard shortcuts are:
- Mac OS: CMD+Shift+J or CMD+Shift+C
- Linux, Chromebook and Windows: Ctrl+Shift+J
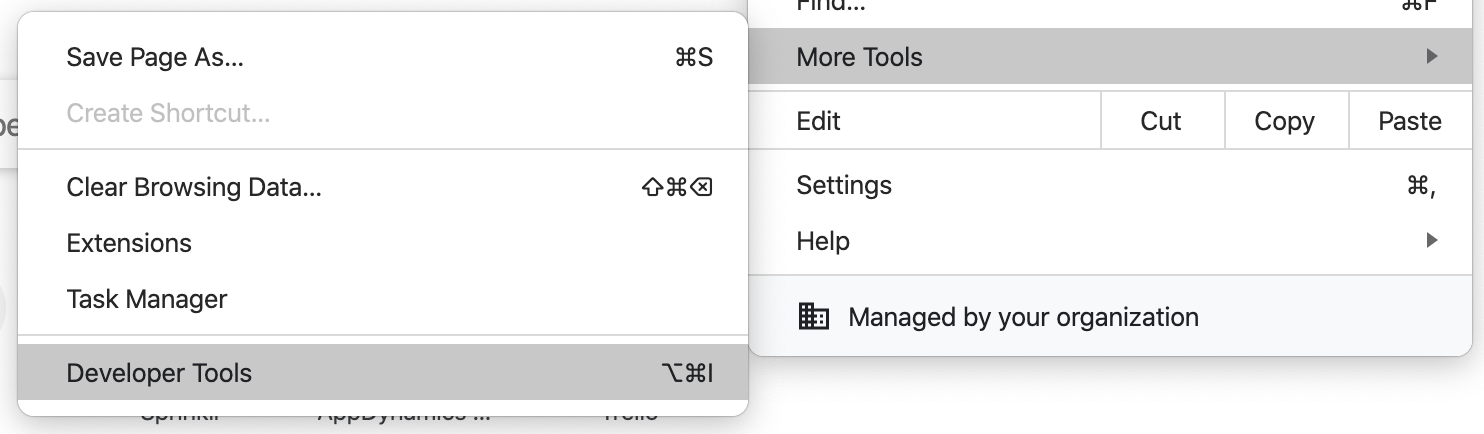
From the Chrome menu:
Open the Chrome menu and go to “More Tools” > “Developer Tools.”
Finally, you can right-click (Windows) or Ctrl-click (Mac) anything on a web page and select “Inspect Element” to open Developer Tools.
The Developer Tools panel will open in whatever web page you’re on. You need to open them again for each new Chrome window, but you can navigate between web pages with them open.
What about on mobile?
Opening Developer Tools on mobile
You can’t access Developer Tools directly on Android. Instead you’ll need to use Remote Debugging. The basic process works like this:
- Connect your Android device
- Open Developer Tools and go to “More Tools” > “Remote Devices”
- Authorize the remote access on your Android device
There doesn’t seem to be a way to do this at all on iOS devices.
5 common uses of Chrome Developer Tools for beginners
Just because you’re not a developer doesn’t mean Developer Tools aren’t for you. Here are five ways you can make your life easier with Developer Tools.
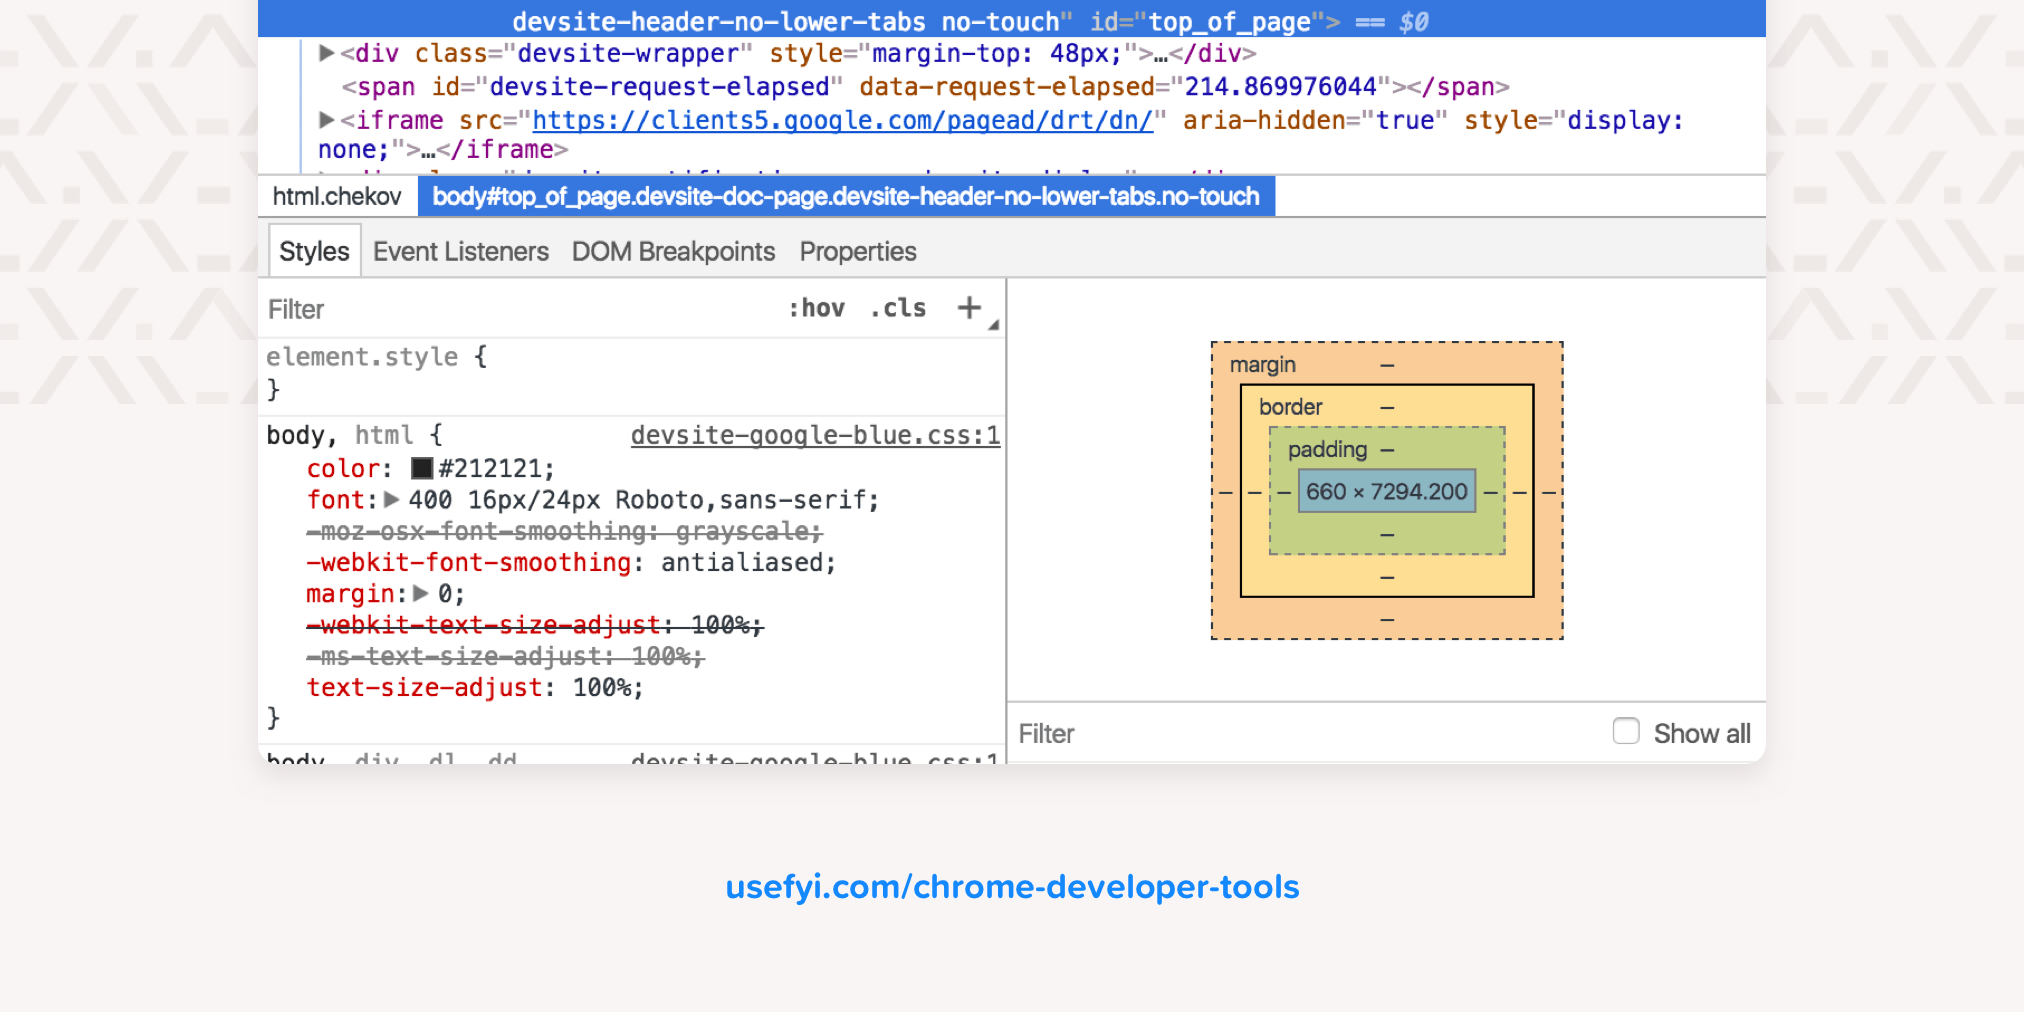
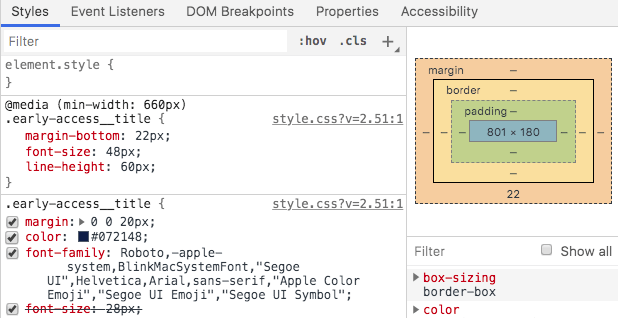
Most of these will use the Elements tab. Here’s a quick guide to that:
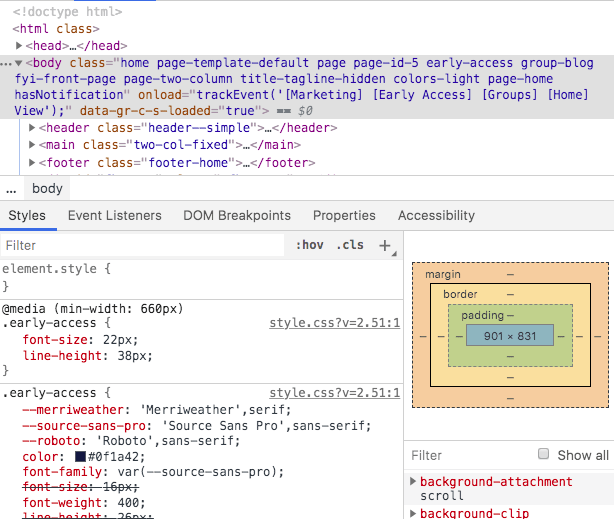
The top section shows the HTML for the site.
The bottom left section shows the CSS styles applied to that page.
The bottom right shows the CSS layout visually so you know what you’re looking at.
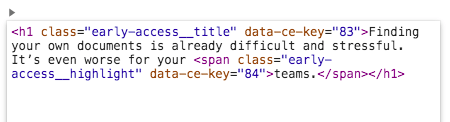
1. Inspect page tags
One of the most important elements of onpage SEO is simple h1 and h2 tags. Snoop under the hood and you’ll find a lot of folks (including those who should know better) aren’t getting this stuff right.
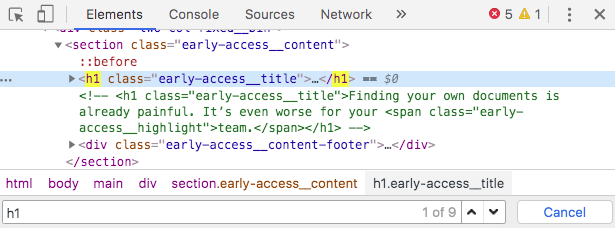
Once you’ve seen pages where the h1 was an unoptimized image, or pages with four h1 tags, you begin to appreciate the urgency of the situation. And tools like Screaming Frog are great but they’re not always 100% accurate. It’s best to check by hand. It’s also very easy.
Open a page, then open Developer Tools. In the Elements tab, press CMD+F or Ctrl-F to search and search “h1” to see your page’s tag(s):
2. Edit CSS
Developer Tools lets you change the CSS of a page directly in your browser. You can trial color combinations, fonts—anything that’s governed by CSS. You don’t have to mess around with the stylesheet and you often don’t have to write a single character of code.
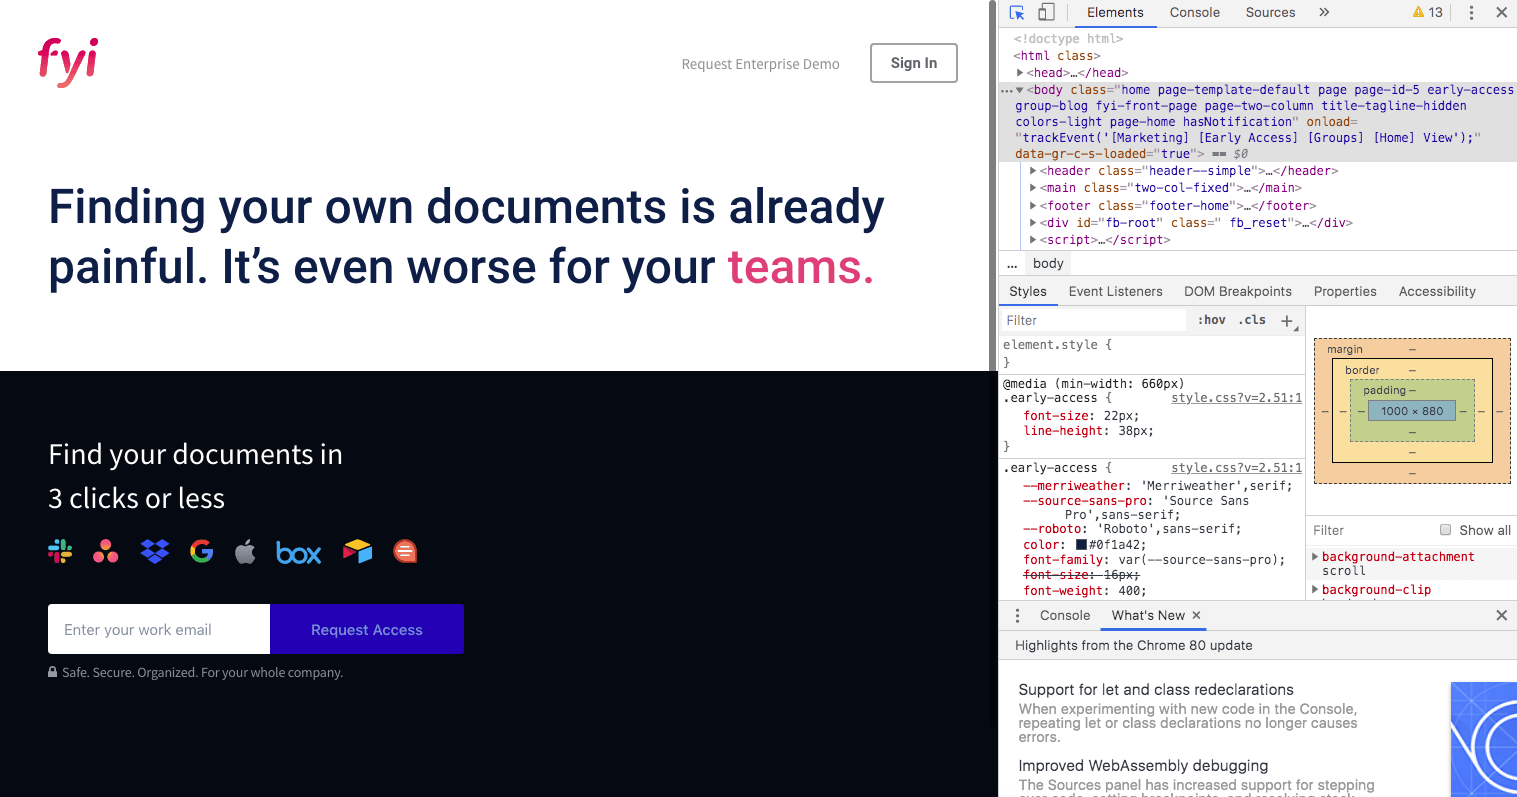
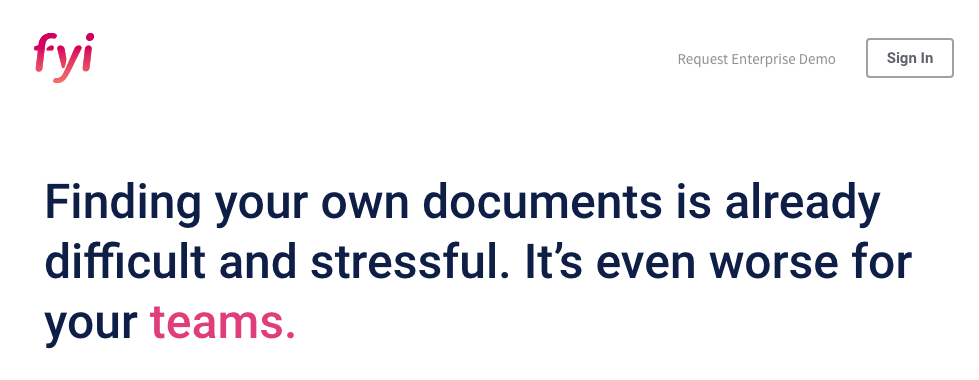
Suppose I want to see what the FYI homepage would look like with red text.
I open the page, then open Developer Tools. Ctrl-click or right-click the element you want to change on the web page. In the Elements tab I find the color for the element in the bottom left panel:
Click on the color box and I can simply click on another color in Chrome Color Picker (more on this later). The text changes immediately.
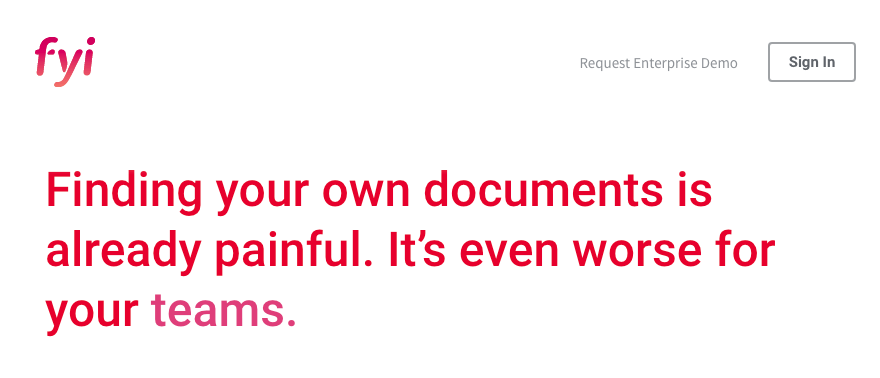
Probably going to leave that black.
3. See what they built the website with
When you visit a website, it’s not always easy to see what CMS was used to build it. But you can find out easily with Developer Tools.
Open the site and Developer Tools, then look at the top right of the Styles panel in the Elements tab:
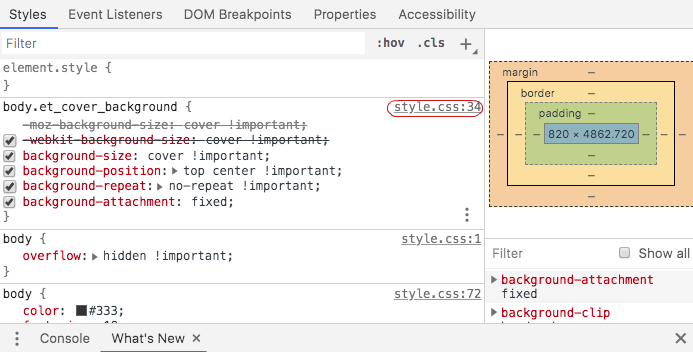
Right-click or Ctrl-click on the link that starts “style.css” and select “Copy link address.” Paste the link into a new tab and it will tell you the CDN and theme used to build the site—in this case, it’s built using Divi on WordPress.
4. Write into the website
If you’re working up copy for a new web page, you can go to one that already exists and write directly into it with Developer Tools. So if layout or sizing is an issue, you can check your copy still looks good in the environment it’s going to be displayed.
Here’s how.
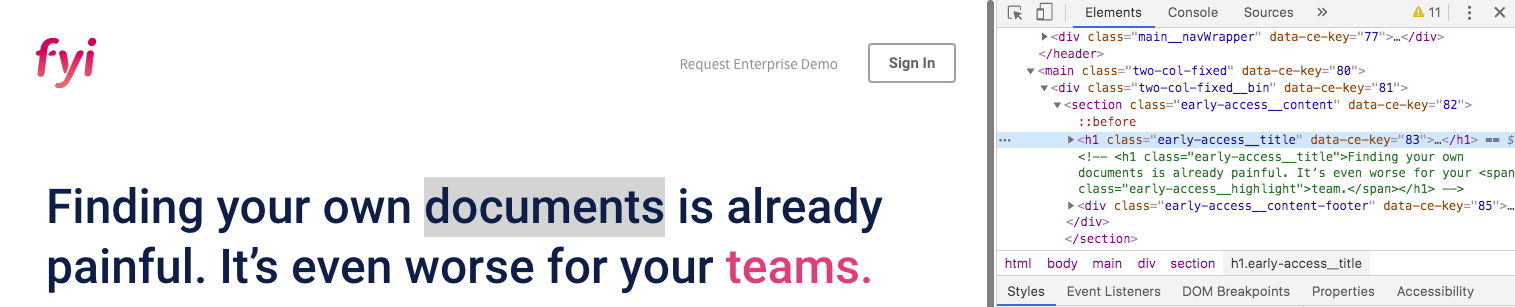
Open Developer Tools on a web page—you can do this with any web page.
With the Elements tab open, right-click a piece of text on the page. You’ll see the relevant HTML highlighted:
Find the three vertical dots on the left side of the HTML for that element, click them, and select “Edit as HTML.”
Even if you don’t know HTML from the DMV, you can still do this: all you’re looking for is the text you clicked on, inside all the code. The HTML is all color-coded, while the text is black. Click on it, and you can type in whatever you like:
Click on the background to exit the HTML and your changes appear in the page itself:
Yes, it looked better before. But this way you can find out for sure, and tailor your copy precisely to the layout and design it will be used with.
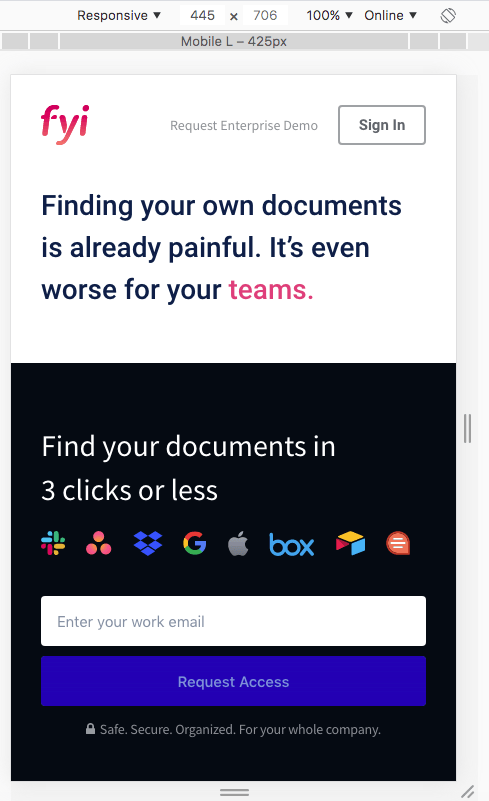
5. See it on mobile
…and on any other viewport you want. Developer Tools lets you manage viewport appearance using both preselected sizes and free scaling.
Open Developer Tools and look at the top menu bar, where Elements, Console, and Source are displayed. You’ll see two icons on the far left of that bar; the one that looks like a stack of mobile devices is what we’re after.
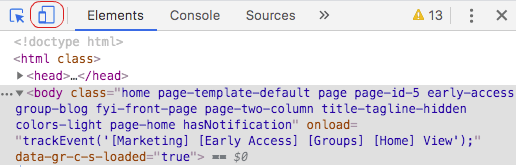
Click that and you’ll see the site you’re on displayed as if you were a mobile visitor:
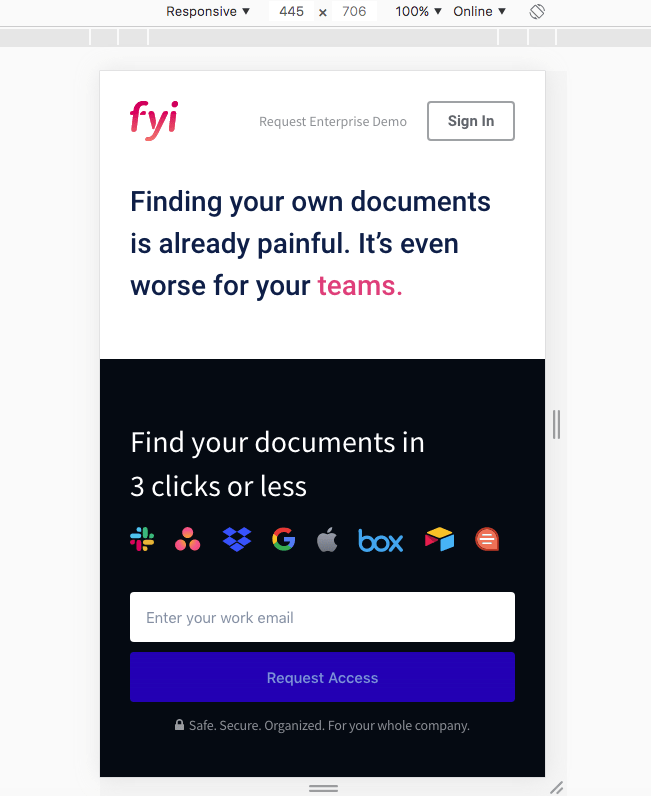
That’s cool, but there’s more you can do with these controls. The icon lets you toggle between mobile and desktop versions of the site. And the controls at the top of the screen let you adjust viewport size. Here’s how it looks on a mobile with a big screen:
Here’s how it looks on a tablet:
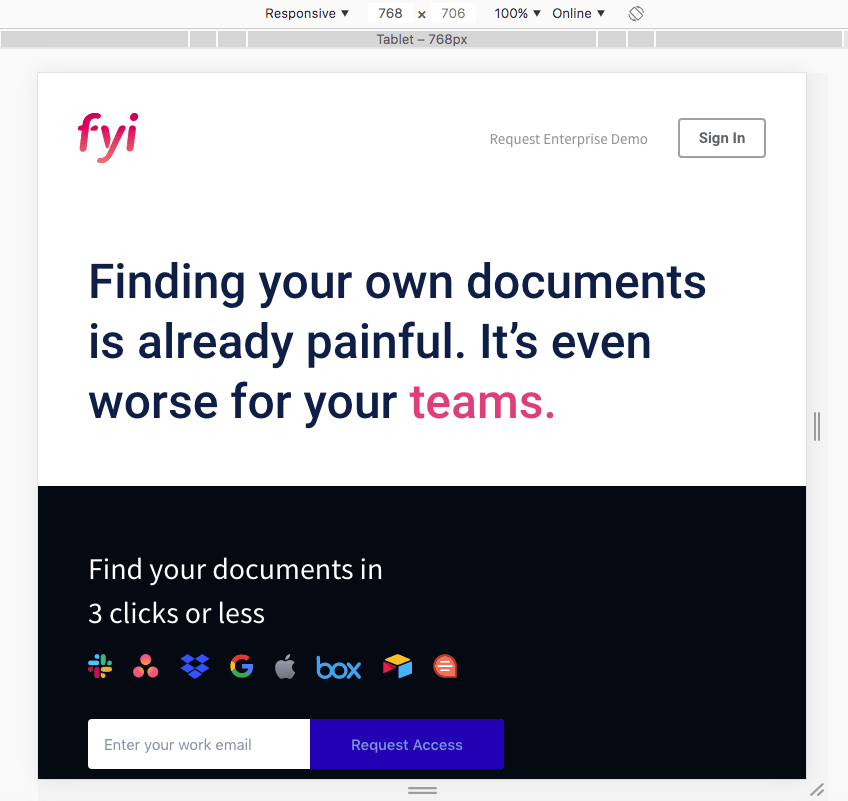
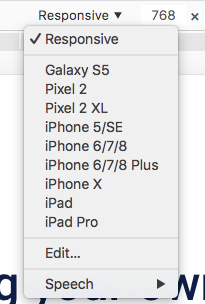
Use these controls to choose the viewport size you want:

Use this dropdown to see what the site looks like on different devices:
Set viewport size yourself:

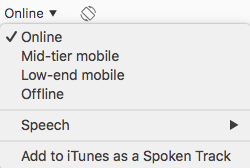
And even mimic different connection qualities as you navigate the site:
You can do all that and more from the menu bar at the top.
What about if you want to stretch the uses for Developer Tools a little more?
We’re not going to dive deep into the ways developers use Developer Tools—this is a beginner’s guide. But here are some things you can use Developer Tools for when you’re feeling a little more confident.
To set your preferences for Developer Tools, manage them through Chrome Settings. Open the Chrome menu, then go to Settings, or type chrome://settings/ into your omnibar.
If you know your way around Developer Tools and these tips still feel pretty basic, there’s a whole new set of in-testing tools available through Chrome Flags. Type chrome://flags#enable-devtools-experiments into your omnibar and you’ll be able to customize Developer Tools.
1. Identify load speed issues
Website load speed is a massive deal. Slow websites kill conversions and visitor numbers, and because Google knows this, it penalizes slow-loading sites. So if your site takes 14 seconds to load, that’s SEO poison too.
Developer Tools will tell you a lot about how and why your site loads slow.
Open your site, then open Developer Tools and go to Network. If you see a “Perform a request” message, reload the page.
Now you can look down the list of events and resources and see what’s taking the time to load.
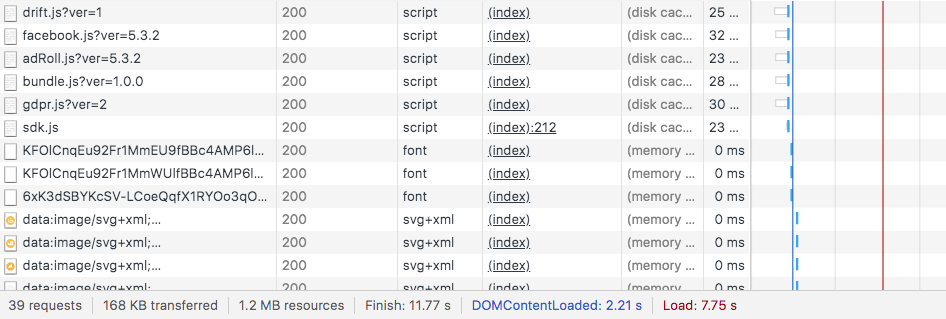
In this instance, there are 39 requests and just 1.2 MB in resources, which is small. Compare that to this site:
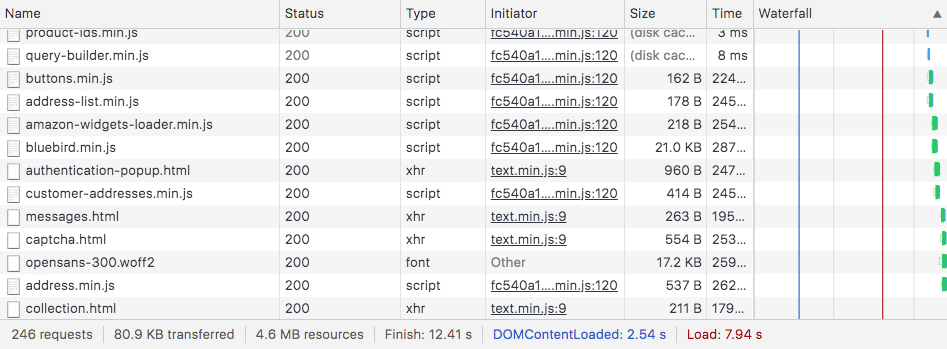
246 requests, 4.6 MB in resources. Big difference, but what difference does it make to users?
The answer to that is on the bottom of the panel. Look for the last three numbers: Finish, DOMContentLoaded, and Load.
DOMContentLoad tells you how long it took to load the HTML for the page before anything else—CSS, JavaScript, whatever else is on there. There’s just 0.29 seconds’ difference between these two sites in DOMContentLoad time. Don’t look for huge differences here.
Load tells us when the page is fully loaded; Finish tells us when all the elements and code in the page is done including asynchronous stuff. That’s a lot of what’s moving around in the second, slower page that’s shown here. You can glance at the table and see a ton of scripts for Amazon and other third-party sites running.
What you can also do is check the usual suspects: inline CSS, images, lots of requests, and a bunch of JS and Flash. It all shows up in the waterfall in the top.
2. Catch non-working plugins
Nearly every website relies on some kind of third-party plugin. Whether it’s tracking code from HotJar or Crazy Egg, form or popup tools, or chat addons like Intercom or Zendesk Chat, it’s crucial to the business the website is meant to perform. When it goes wrong it’s not always easy to know it’s happening, never mind how or why.
There’s an easy way to catch it in Developer Tools.
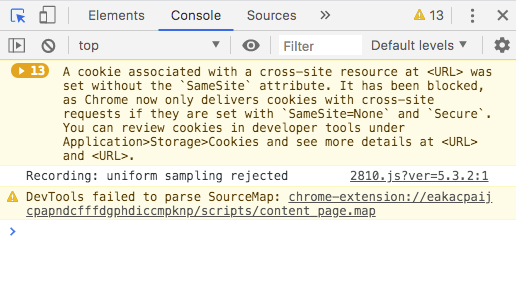
Open the site you want to check, open Developer Tools and go to the Console tab.
Errors will be flagged in red:
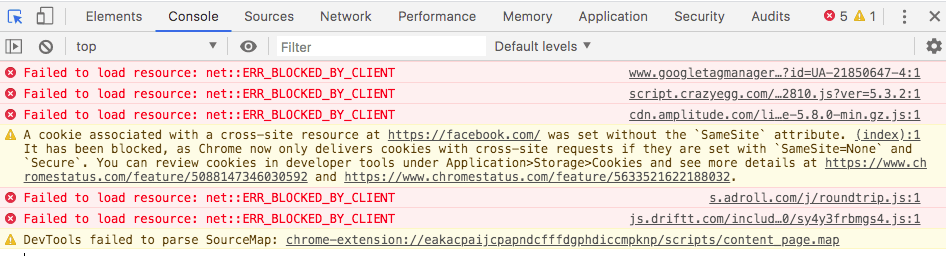
If you’re seeing a page full of “BLOCKED_BY_CLIENT” it’s probably because you have an adblocker running.
On the other hand, this company hasn’t put the code for their tracking tool into their website correctly:
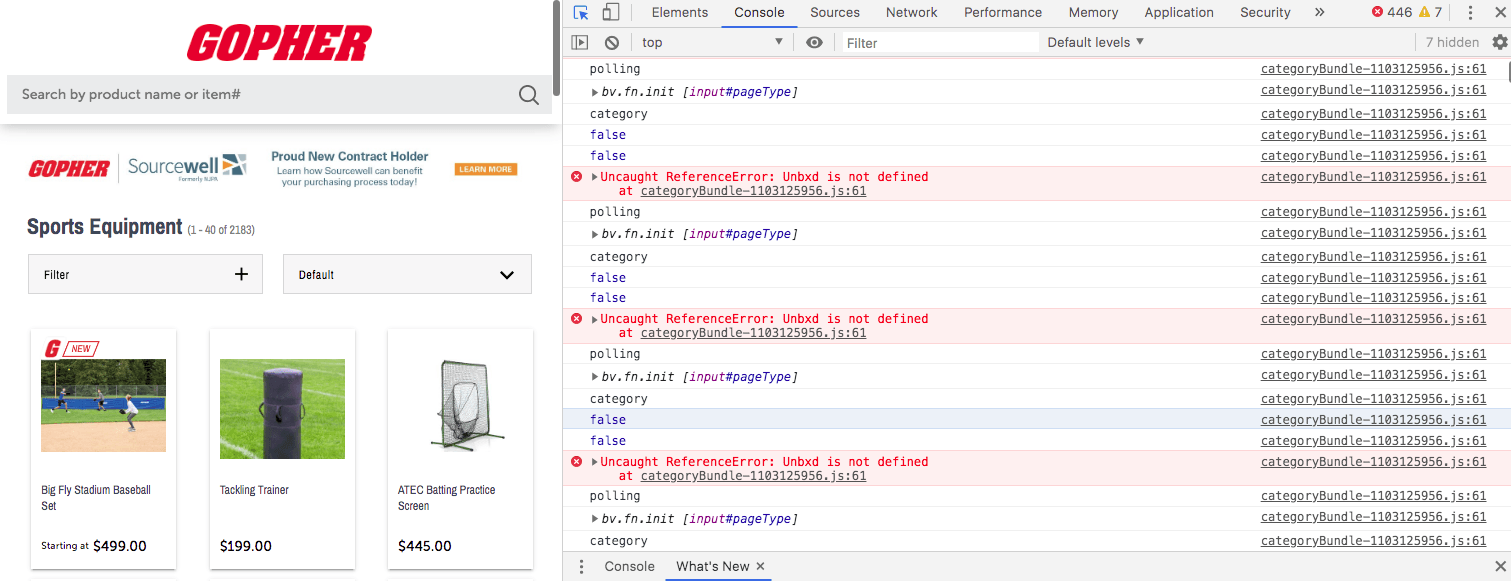
Those “Uncaught Reference” errors are the UNBXD tracking code not working. The reason is because “there is a non-existent variable referenced somewhere. This variable needs to be declared, or you need to make sure it is available in your current script or scope,” according to Mozilla’s JavaScript tutorial.
Even if you have no clue what that means, you do know that the tool isn’t working. That’s vital information that your development team, marketing department, and a bunch of others at your company will want to know.
3. See what technology a site is using
You’re selling tech, but you don’t know if this business is a potential customer. Some technographic information would be nice. Let’s open Developer Tools and get some.
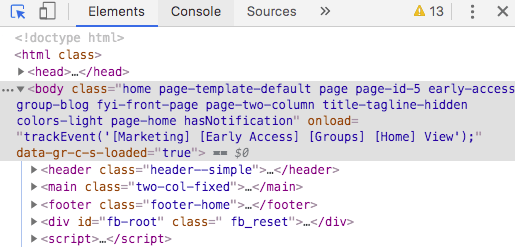
With Developer Tools open in the Elements tab, find the <head> tag in the HTML and click on it to expand the section.
You’ll see all the tracking JavaScript for the site:
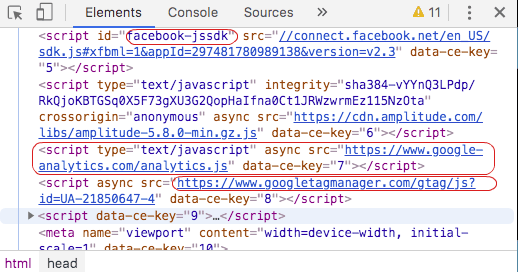
Facebook, Tag Manager, Google Analytics… if they’re using anything more specialized that will show up here too.
4. Logo Grab
You’re building a deck or some other piece of content and you need logos, but you can’t find the website’s press kit. What to do?
Mouse over the logo on the homepage, right-click or Ctrl-click and select “Inspect.” Developer tools will open, and the code for the logo will be highlighted in the HTML displayed on the Elements tab. Look in the code for a full URL that starts https://. Copy and paste that into a new browser tab and you have the logo, usually as a fairly large PNG.
The alternative is to open Developer Tools and head to the Network tab, then look for the image you want. You don’t have to scour all the elements on the page manually. You can filter by type for images in this panel:
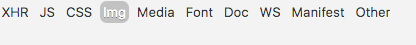
When you find the one you’re looking for, it’s displayed in the Preview panel alongside.
Right-click/Ctrl+click on the image preview to get the option to save the image or download it, or save it as a data URI.
The only time this doesn’t work is when the logo is an SVG that’s actually been drawn on the page. That’s when you’ll have to take a screenshot or search Google images.
5. Color Picker
Chrome has a surprisingly powerful built-in color picker. You can get hex, RGBA, or HSLA color codes for any element of a website you’re looking at, from logos to text to background colors.
Open Developer Tools and stay in the Elements tab. Look at the bottom half of the tab, in the Styles tab, for a CSS element that has the quality of color:
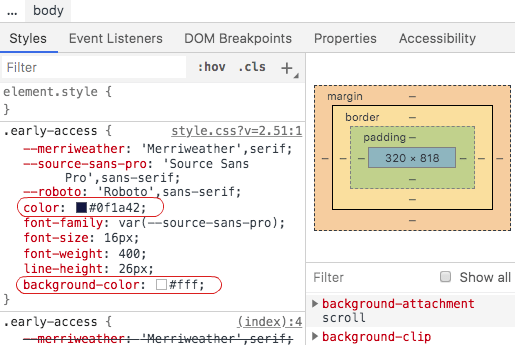
So far, so good: you can see the color information for that element.
Click on the CSS element and you’ll open the full-feature Chrome color picker. You have to click on the tiny box that actually displays the color visually, not the text.
You’ll see this:
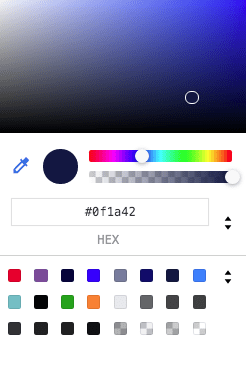
Use the eyedropper to detect the color of any element on the page, then copy the hex, RGBA, or HSLA color code from underneath.