The Ultimate Manual to Asana Gantt Charts
If you want to learn how Asana Gantt charts work and how they can make your project management more efficient, this article is for you.
Asana is among the world’s leading project management tools, with many features for agile software development teams, cross-functional project managers, and fast-paced technology companies.
Gantt charts are among the core features in Asana that allow you to visualize your project schedule, dependencies, and overall timelines.
In this article, we’ll discuss where Gantt charts fit in the overall Asana ecosystem and how you can use them to improve your project management.
What is Asana Anyway?
Asana is a popular project management tool that allows for real-time collaboration with team members. The tool can be accessed via web and mobile apps. Before we dive into Asana’s Gantt charts, let’s briefly take a look at what Asana offers.
Improved Teamwork
Asana’s real-time collaboration capabilities bring your team on the same page. When done right, everyone knows what they’re responsible for, what they need to deliver, and by when.
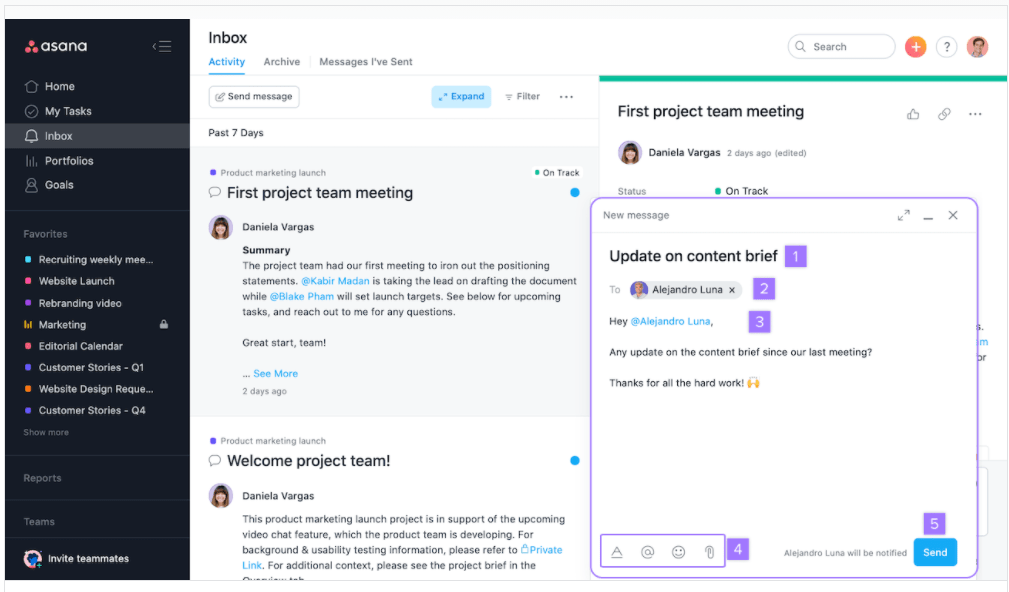
On top of that, the ability to communicate within the app via messages, adding attachments to messages, and liking posts as a means of acknowledgment and appreciation greatly reduces the need for email communication, saves time, and helps your team focus on getting the work done.
Project Visualization
One of the most important features of Asana is project visualization. It uses several layouts to display project status and progress to all the stakeholders involved. These layouts are:
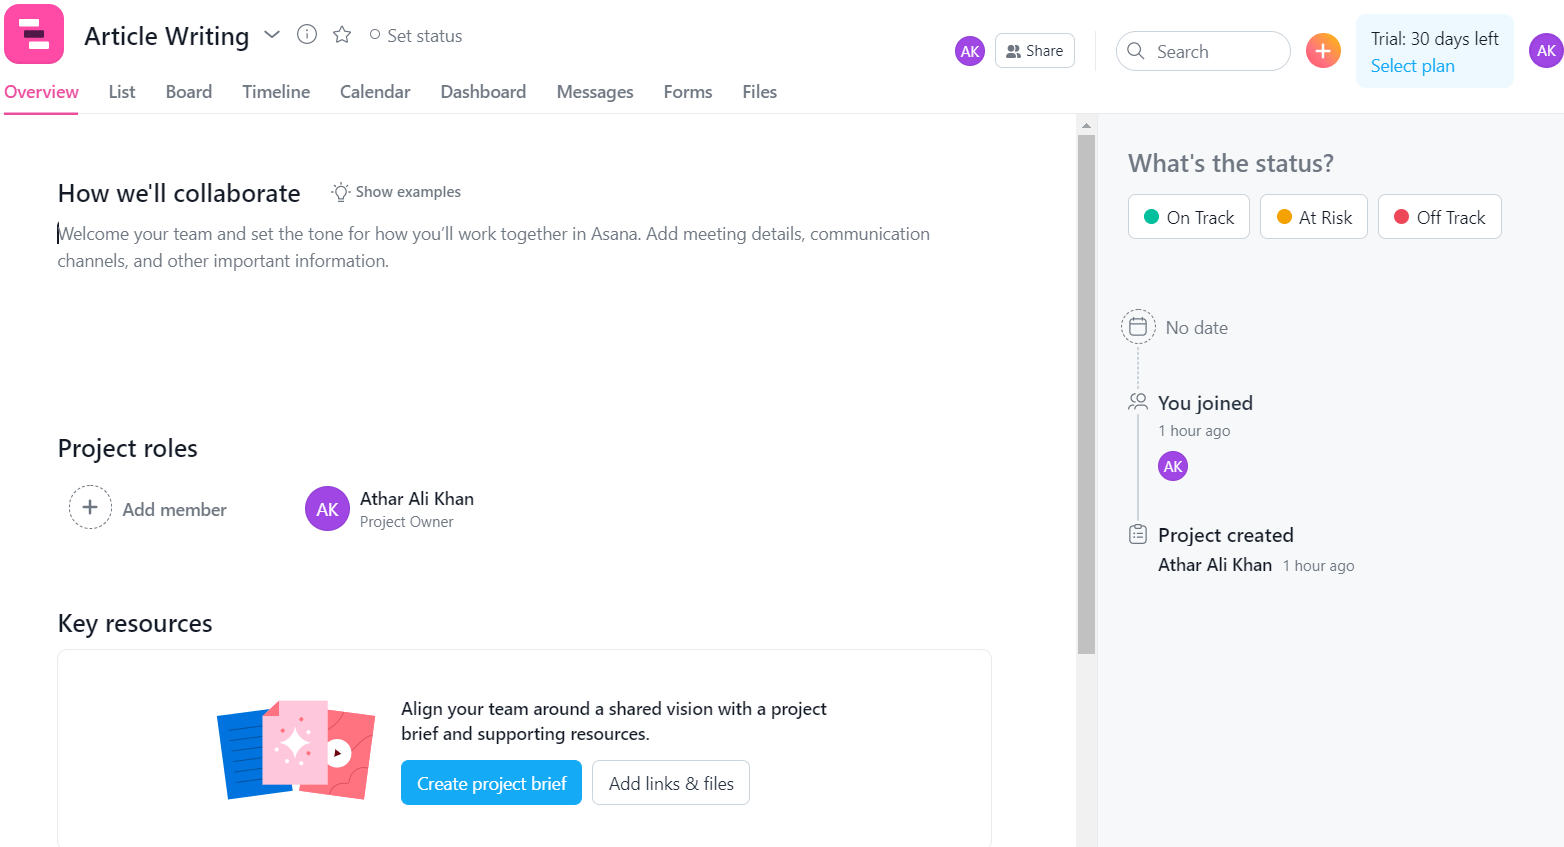
Project Overview
The Overview tab allows project members to state the high-level goals of the project, expectations, meeting details, relevant modes of communication, team structure, attachments, project briefs, etc.
This serves as a point of entry and onboarding for any team members joining a given project at any point in time. Furthermore, the project manager can also indicate whether a project is on track or requires extra attention to meet its timelines.
List
This is the simplest yet among the most effective ways to look at many projects. The simple list of tasks offers a minimalistic view of what needs to be done, by whom, and when.
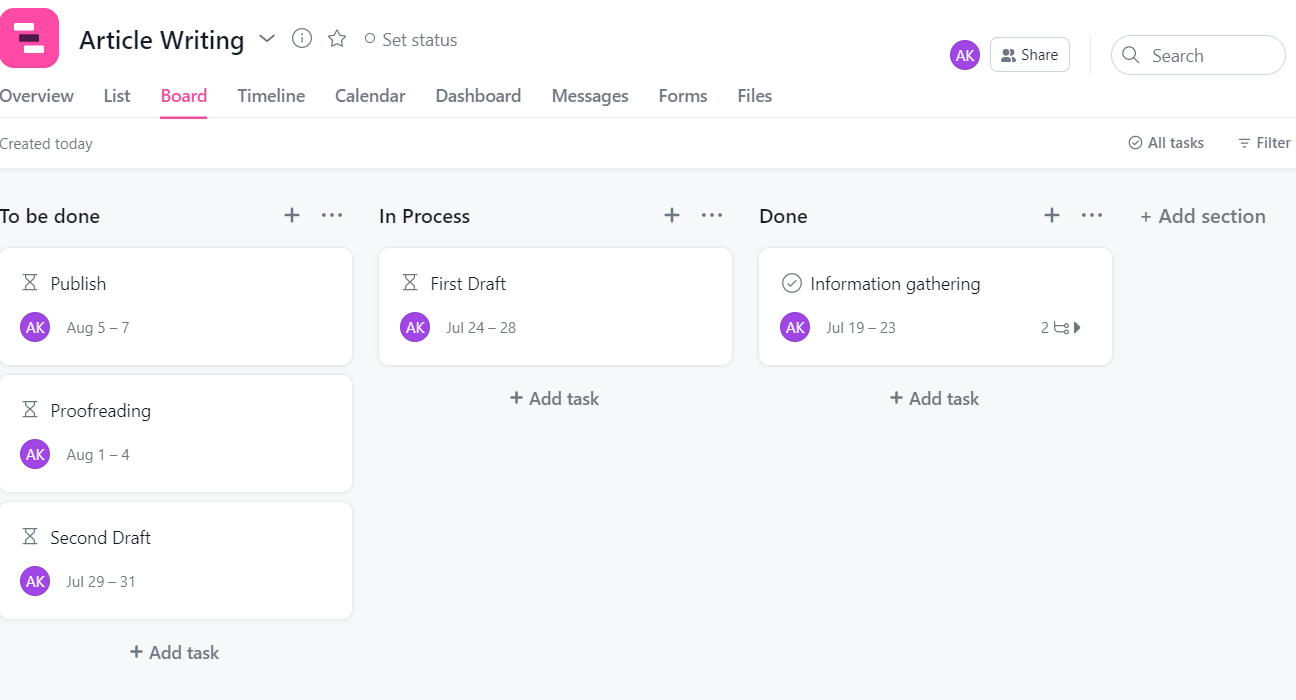
Board
The Board layout in Asana offers the Kanban approach to project management. Users can create cards with tasks written on them and place them in columns that indicate their status. Typically, these columns indicate a pending, in-progress, and completed status, respectively. Cards/tasks progress from one column to the next as they move towards completion.
Timeline
Gantt charts in Asana are displayed in the Timeline layout. We discuss this in more detail later in the article.
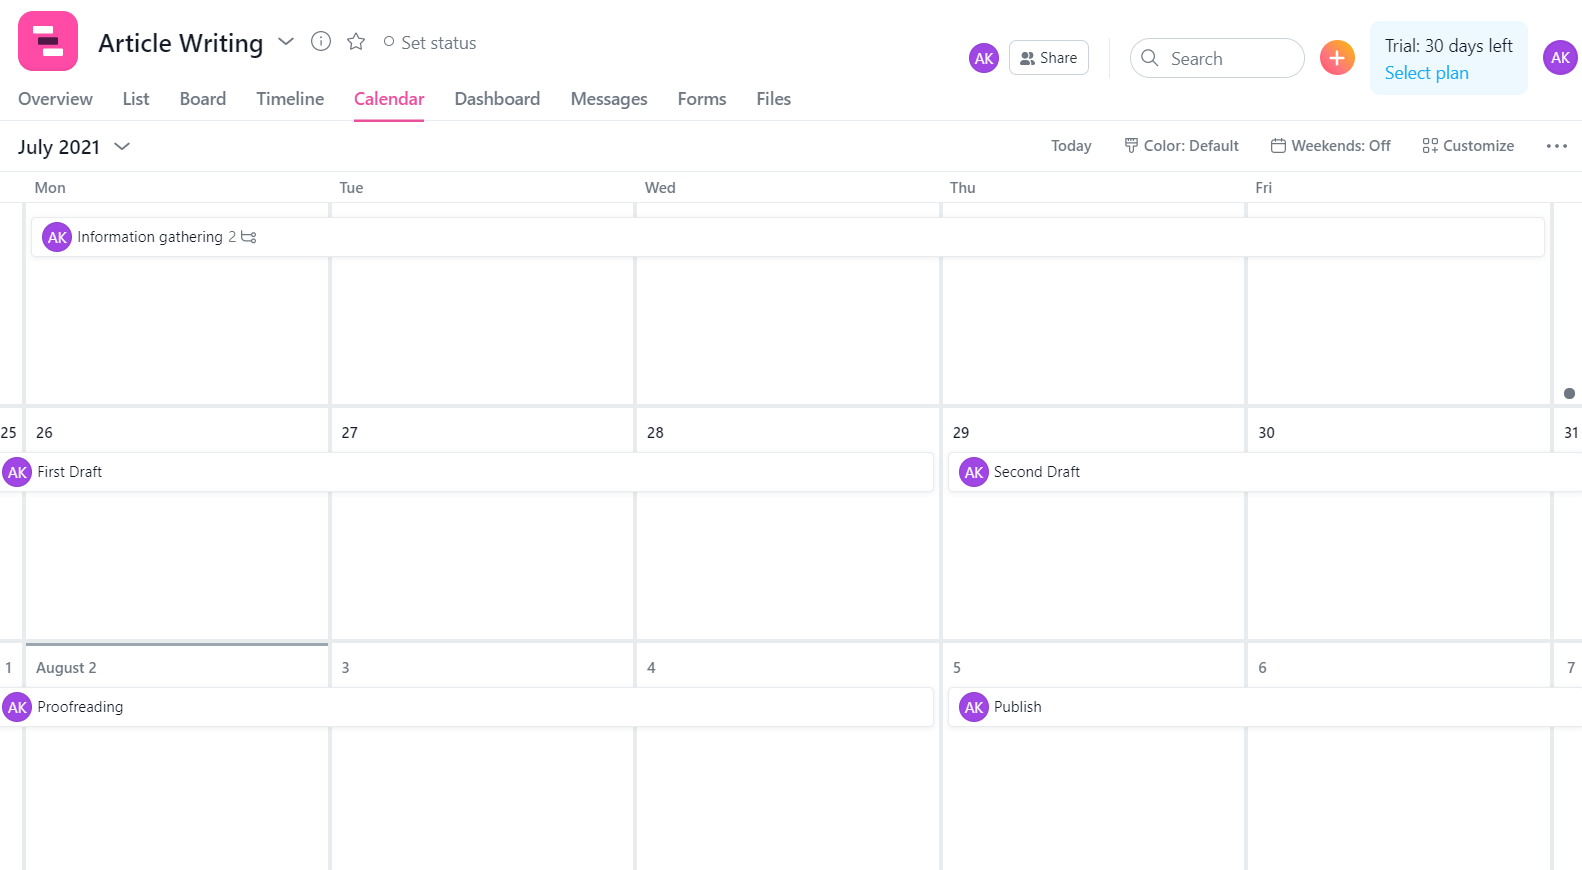
Calendar
The calendar view is, you guessed it, a calendar–but with an overlay of a project’s tasks on it. This layout is particularly helpful when a project manager wants to focus on timelines and is looking to review the amount of work being done on particular days of the month to potentially balance out any inconsistencies or inefficiencies.
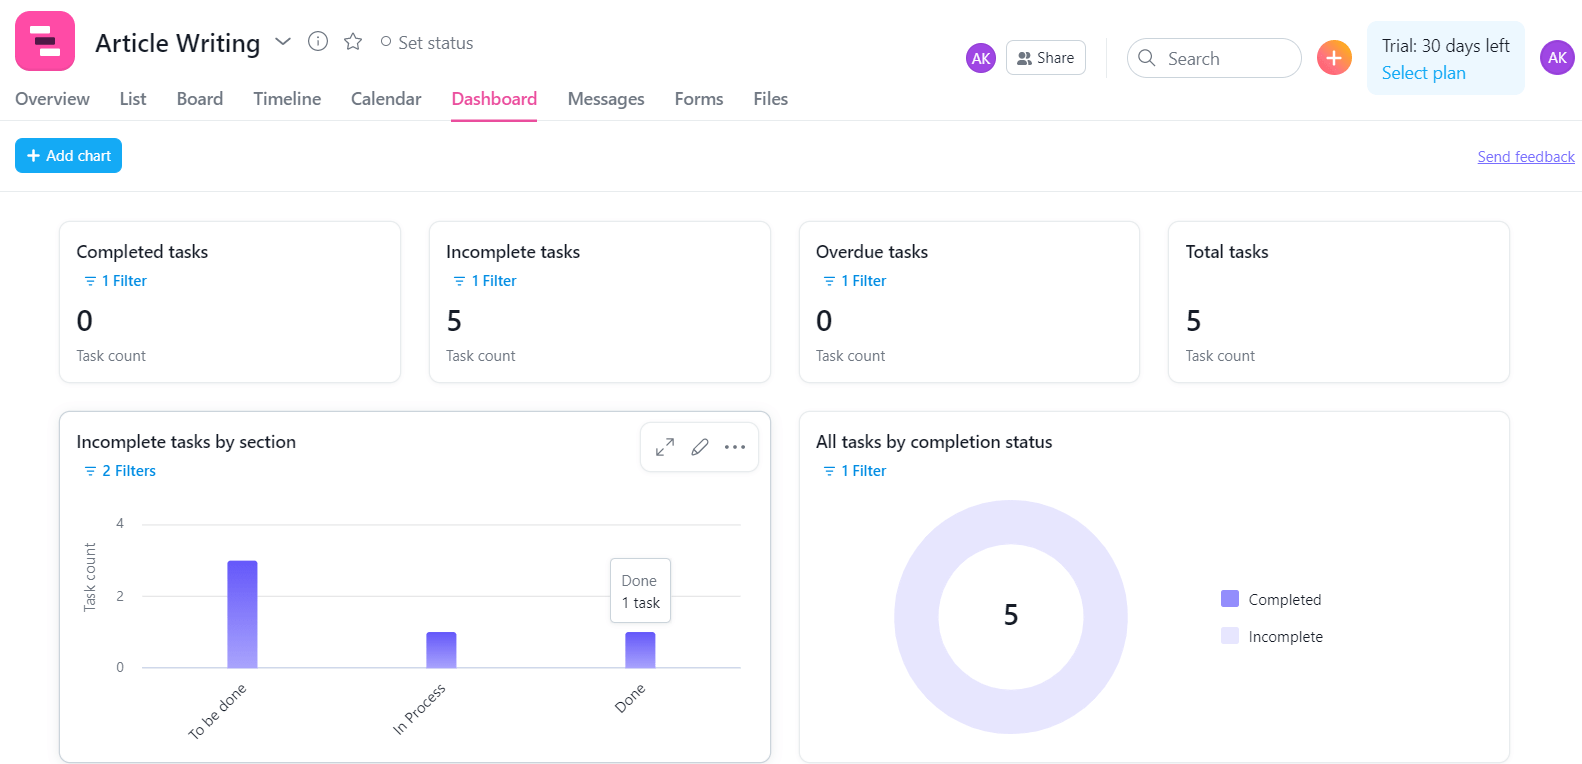
Dashboard
A dashboard is an essential form of project visualization. It provides a hawk-eye view of the project and makes it easier for the team to optimize any inefficiencies in the system by giving statistics on completed, incomplete, and overdue tasks. Furthermore, the dashboard also displays tasks split by team members. This allows the project manager to ensure no team members are overburdened or under-utilized.
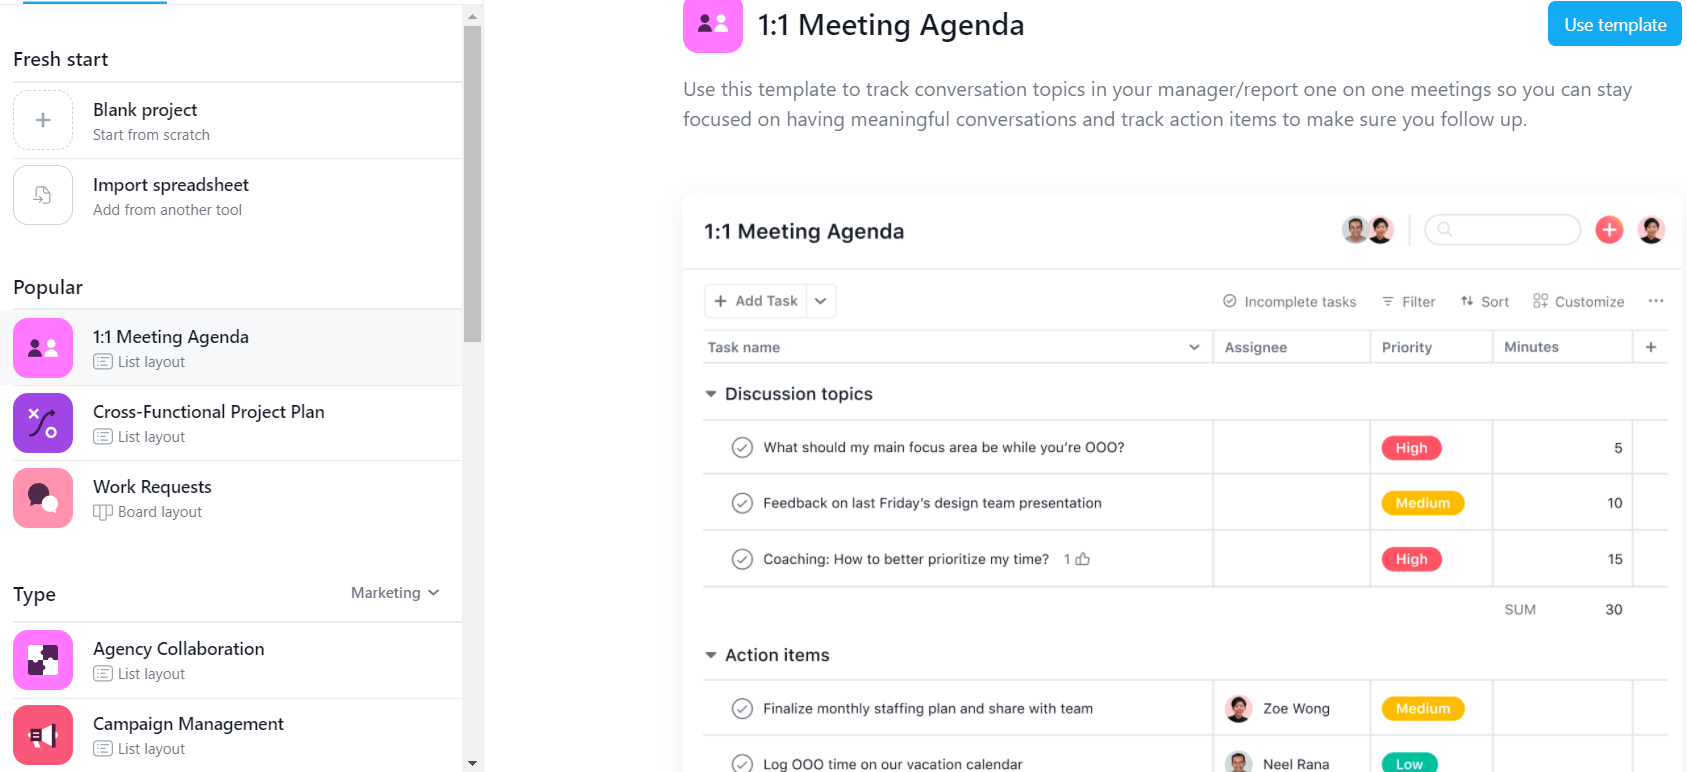
Project Templates to Get You Started
Asana is user-friendly and is used by project managers of various levels of experience. To make sure everyone can get a head-start, the tool contains numerous templates for a wide range of industries and use-cases.
Templates can be selected when starting a new project. Based on the chosen template, the project is automatically populated with standard tasks and milestones for a typical project of its kind from the given industry.
Integrations With Popular Apps
Asana has built integrations with a broad range of popular apps, including Slack, Outlook, Gmail, MS Office 365, Google Calendar, etc. This allows Asana to pick up tasks from within these apps and allows for a seamless project management experience.
For example, if a Slack user wants to integrate with Asana, here’s what they’d have to do:
Step 1: Visit the Asana App Integrations page
Step 2: Find the app they’re interested in. It’s Slack in this case.
Step 3: Follow the instructions and install the integration.
Step 4: Type “/asana create” in Slack followed by task name to directly create a task from the Slack app.
A similar process can be followed to integrate Asana with other apps.
Before we digress any further, let’s come back to the question of what a Gantt chart or Timeline in Asana is all about.
Gantt Charts in Asana
You have already read briefly about Gantt charts and how they’re called Timelines in Asana. Now it’s time for a deep dive.
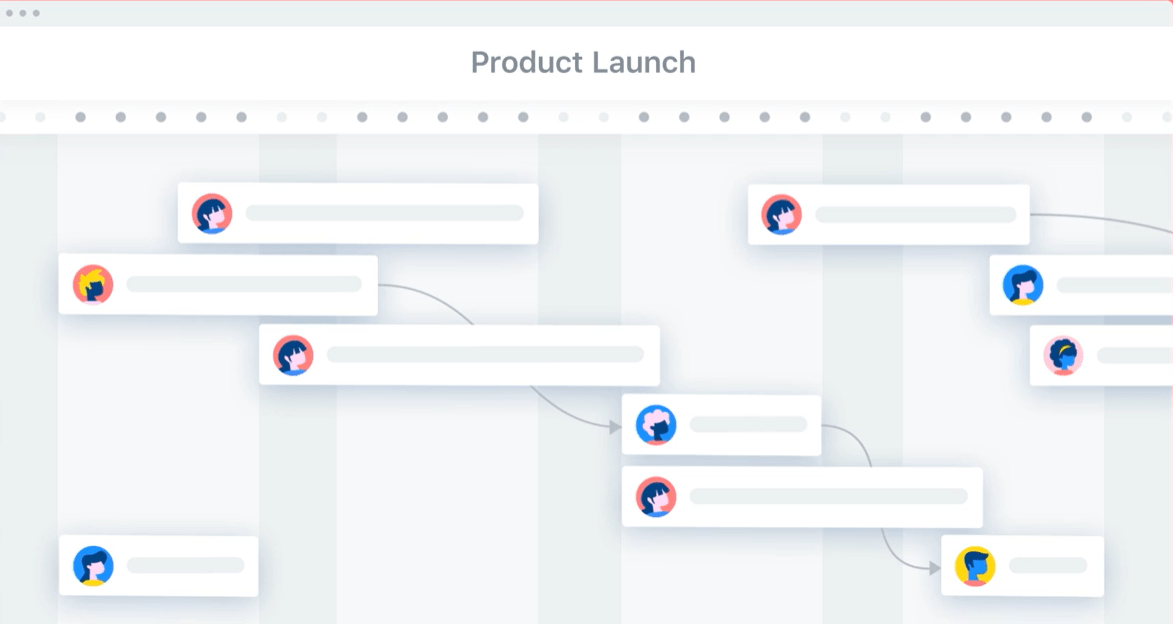
A Gantt chart visually tells the story of a project and is a powerful tool used by project managers to track tasks, deliverables, timelines, assigned resources, and dependencies.
In Asana, look for the Timeline tab inside your project to create your first Gantt chart. A Timeline in Asana is displayed as a set of horizontal bars running parallel to a series of dates indicating a timeline. The length of each bar corresponds with the amount of time required to complete it. These bars can easily be dragged, dropped, and resized based on your project’s needs.
How Asana Gantt Charts Work
Gantt charts have been around for a long time. So you may have heard of them before. Now think of a Gantt chart on steroids. That’s what an Asana Gantt chart is.
Not only does an Asana Gantt chart (Timeline) do everything a Gantt chart is supposed to do, but it also adds Asana’s collaboration capabilities to the chart.
This means a project manager can add their team members to a project and assign tasks, define timelines, and mark priority levels. Once this is done, switching to the Timeline view inside the project would automatically display the Gantt chart.
Asana has integrated social media-like features to make collaboration with team members easier and more fun. For example, when a task is assigned to a team member, they receive a notification for it on the Asana website and the mobile app. From there, the task can be viewed, commented on, liked, and marked as complete.
Example 1: Managing a Website Development Project
Let’s take the example of managing a website development project in collaboration with an agency and a cross-functional team within your organization. A Gantt chart would be ideal for such a project to have all the stakeholders on the same page and to set expectations of timelines, priorities, roles, and responsibilities.
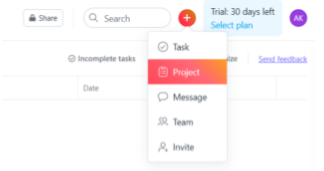
Create a New Project
To start off, create a new project in Asana.
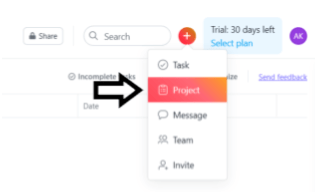
You can select a blank project or use an existing template. For simplicity’s sake, let’s use a blank project here.
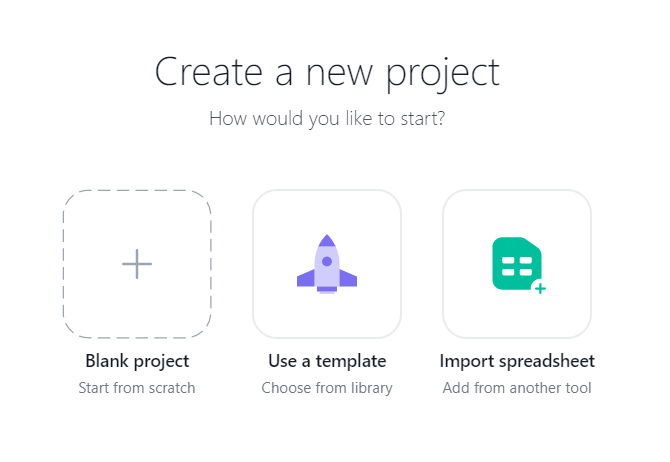
Finalize Project Creation
Name the project and select your preferred layout. In this case, we’re going to choose the Timeline/Gantt chart view. But depending on our needs, we can switch to other types of views for our project.
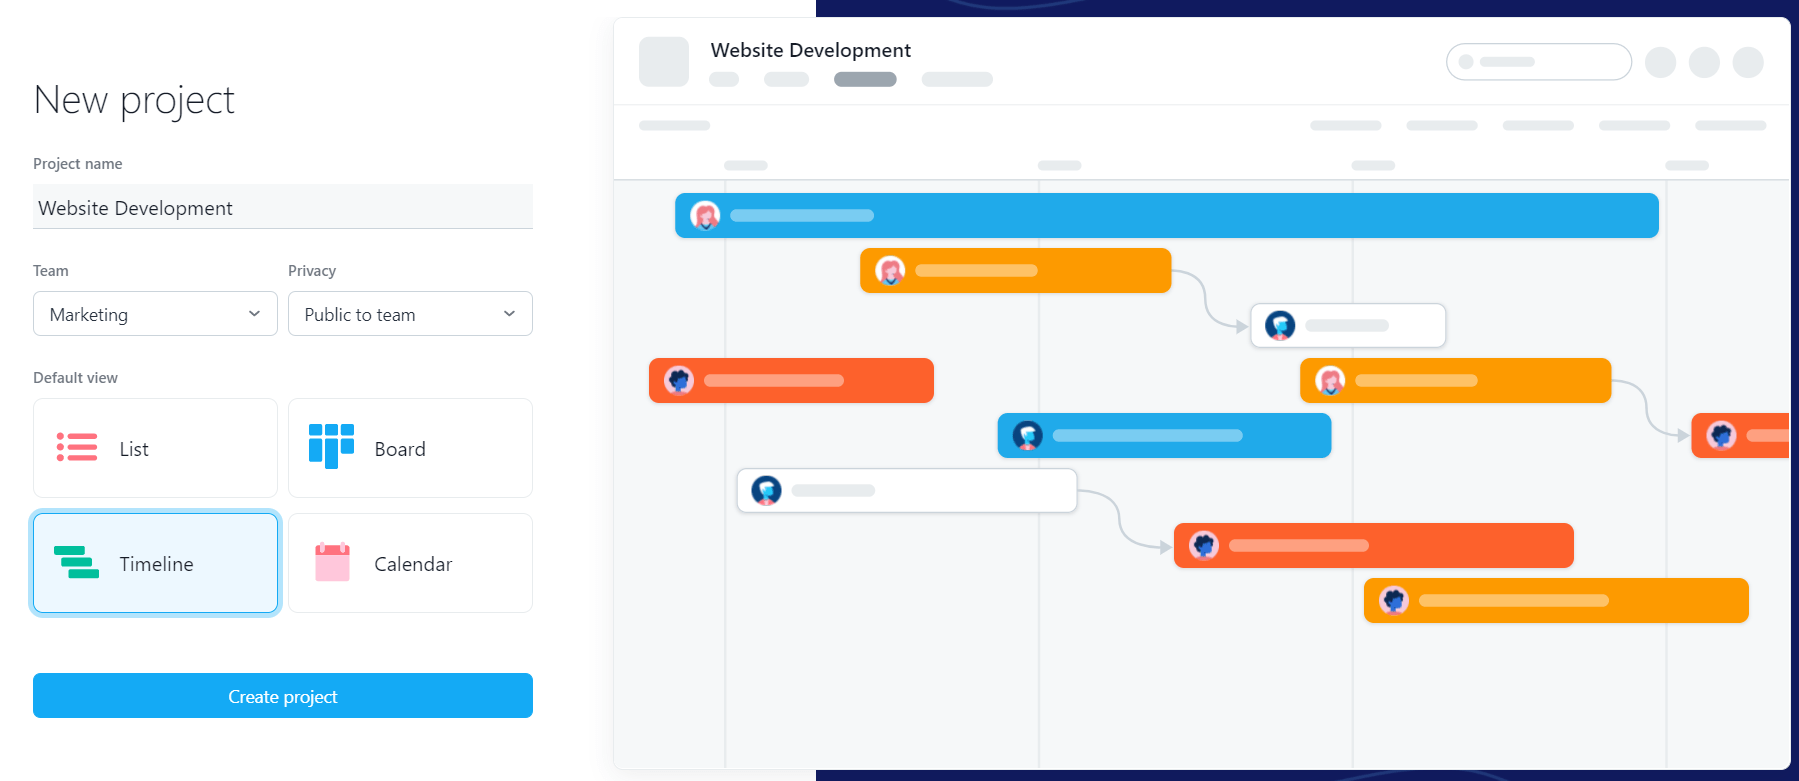
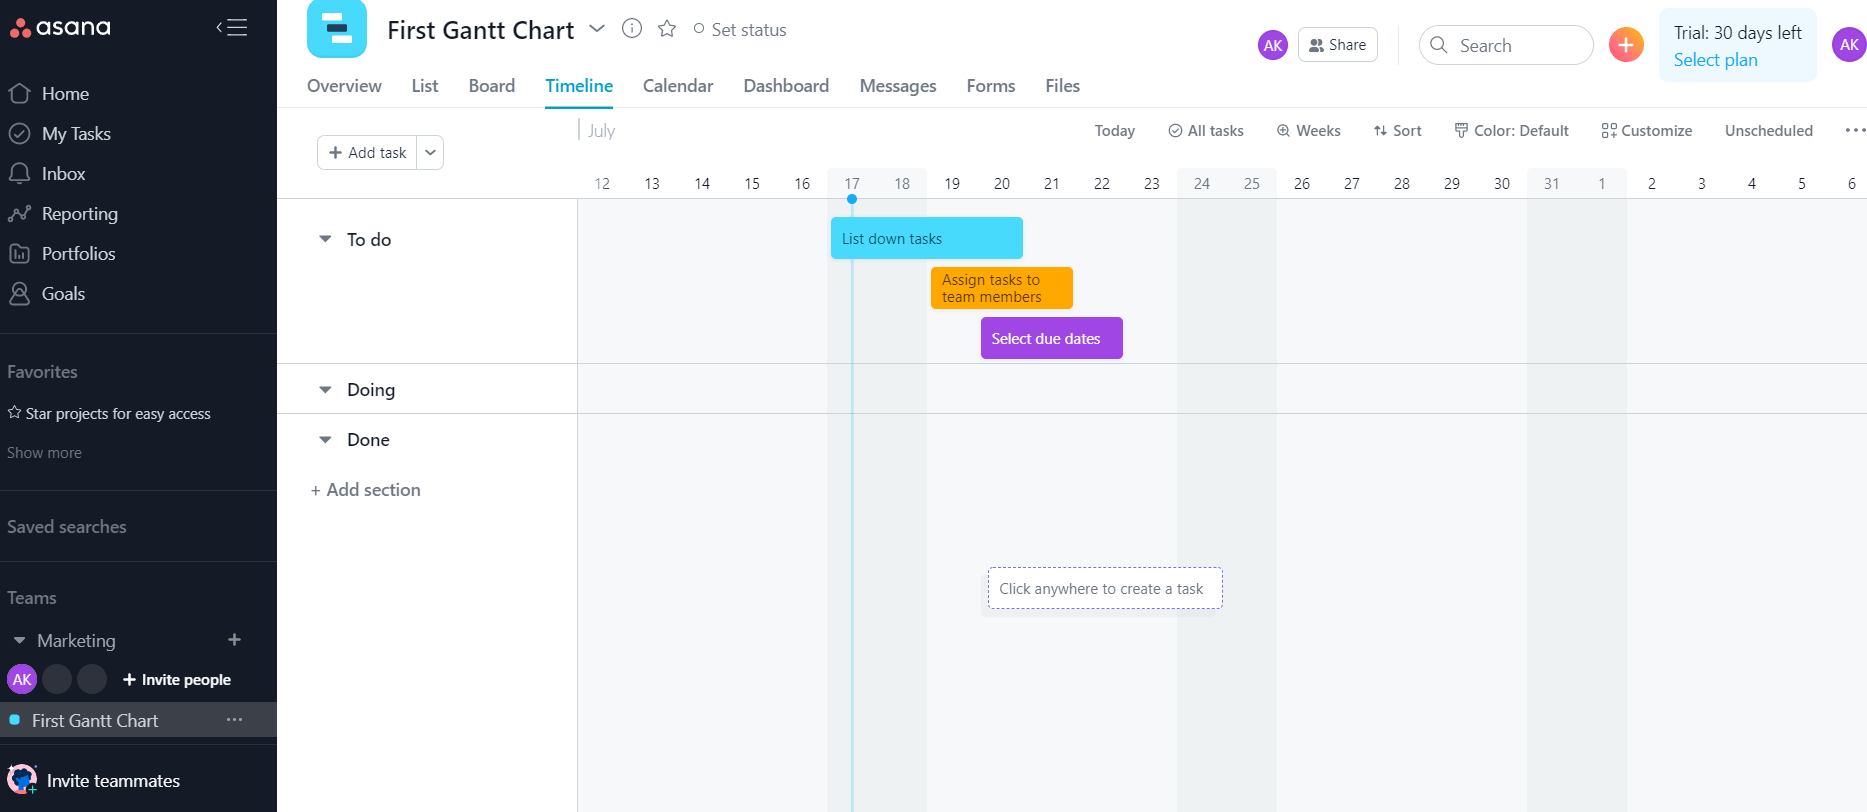
Et voila! Your project is born. An empty Timeline/Gantt chart welcomes you like a blank canvas.
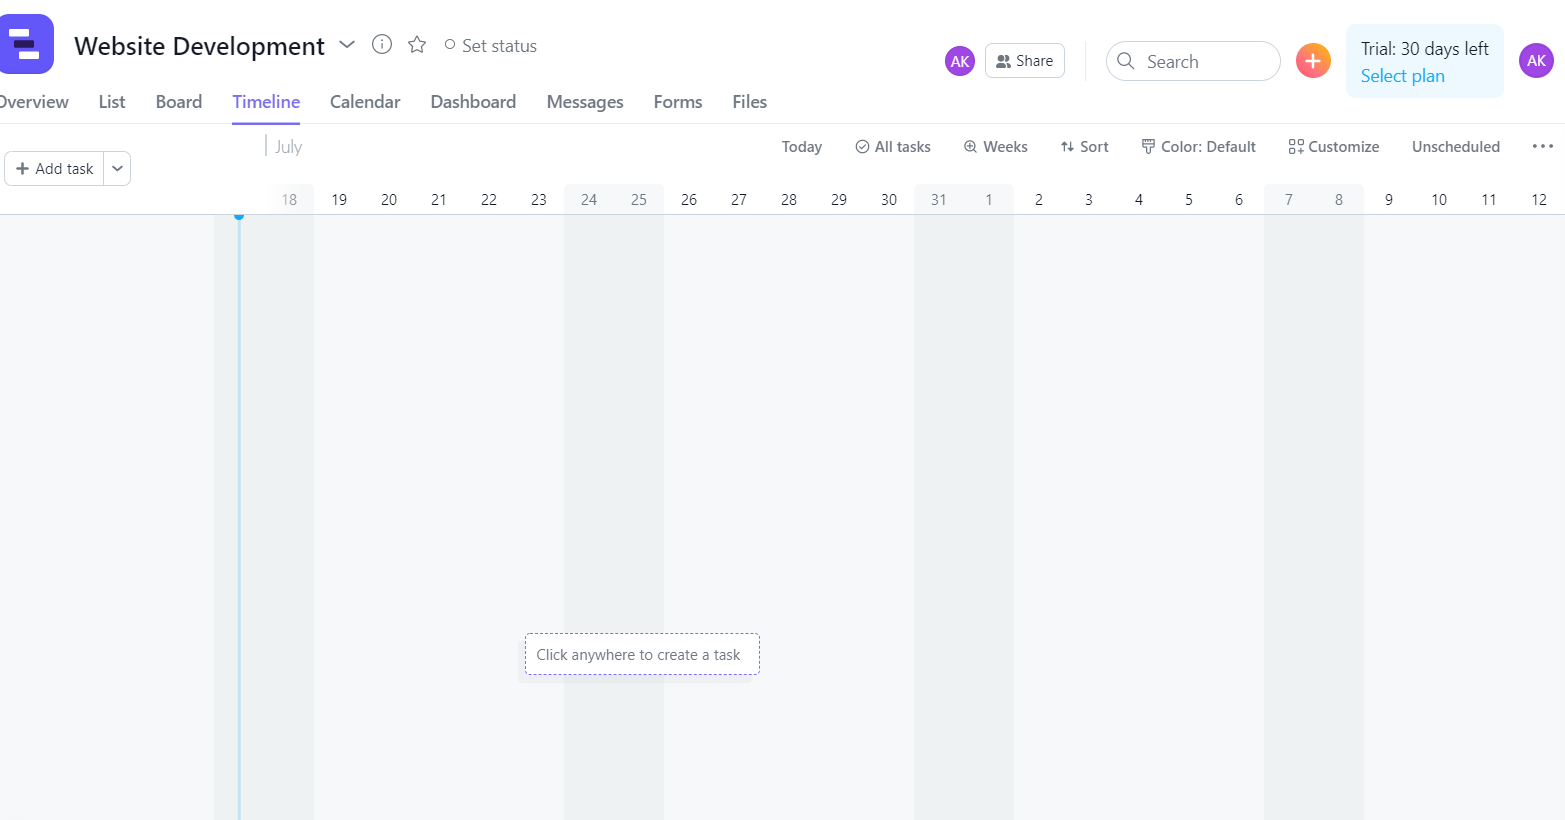
Create Tasks
The natural next step from here is to add tasks to the project. You can click anywhere on the Timeline to add a new task, depending on when you’d like to start and end it.
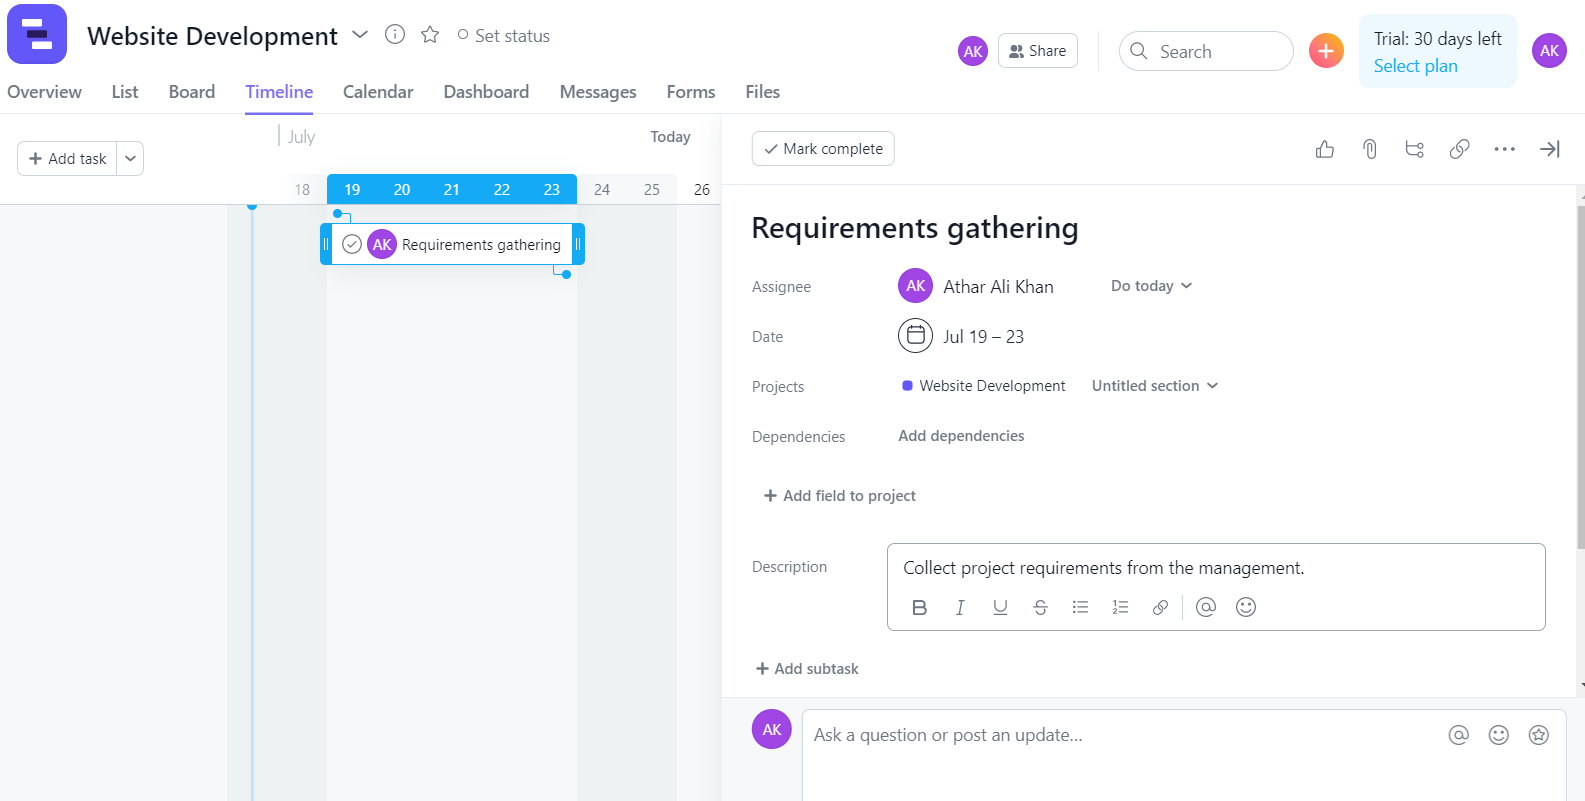
As shown above, a horizontal bar appears as soon as you click anywhere on the timeline. You can enlarge or shorten it based on the time you wish to spend on the task. Clicking on the horizontal bar opens up a details box where you can assign responsibilities, pick a due date and sub-section if you want to organize your project to that level.
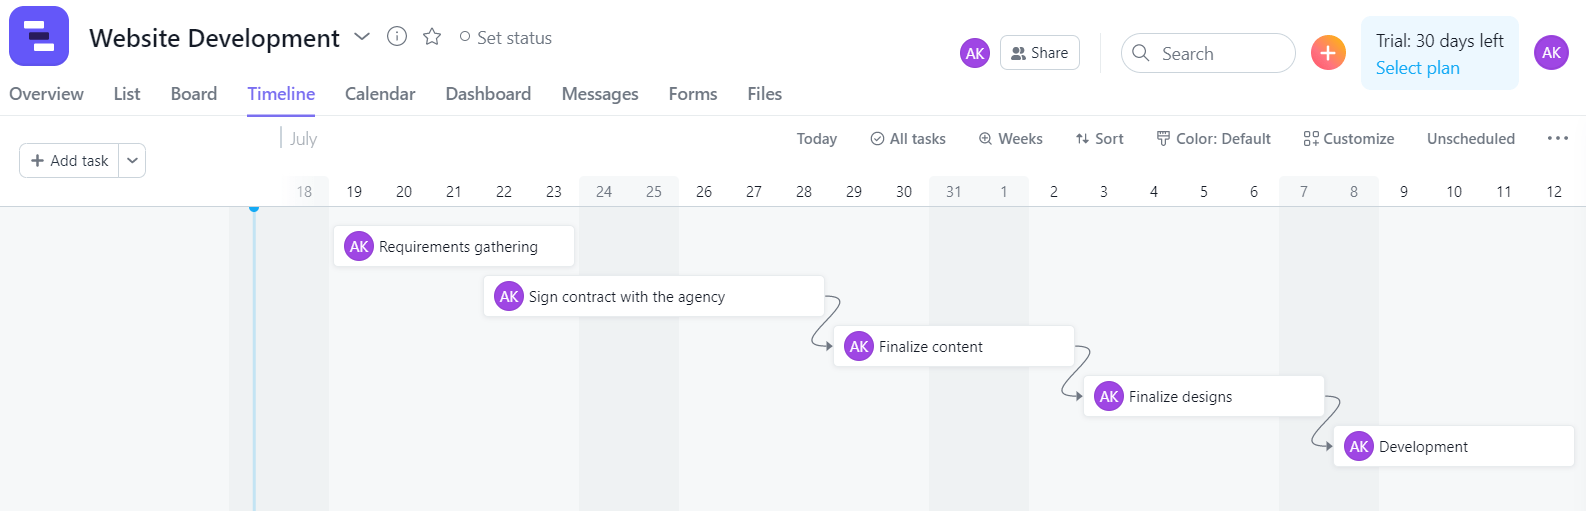
An important feature to note here is Dependencies. This is where you can clearly show the team that a certain task cannot be started until a different task has been completed. In our example, the development of the website cannot begin until a contract with the agency has been signed. Tasks with defined dependencies have arrows connecting them, indicating their relationship.
Here’s what our project Gantt chart would look like in its simplest form.
Example 2: Working Solo on an Article
There’s no doubt that Asana Gantt charts are best utilized when working on medium to large-scale projects with multiple stakeholders and team members. But that doesn’t mean you can’t use this powerful tool for managing your solo projects.
Take the example of writing an article. Just like before, we would create a new project and select a blank template to keep it simple.
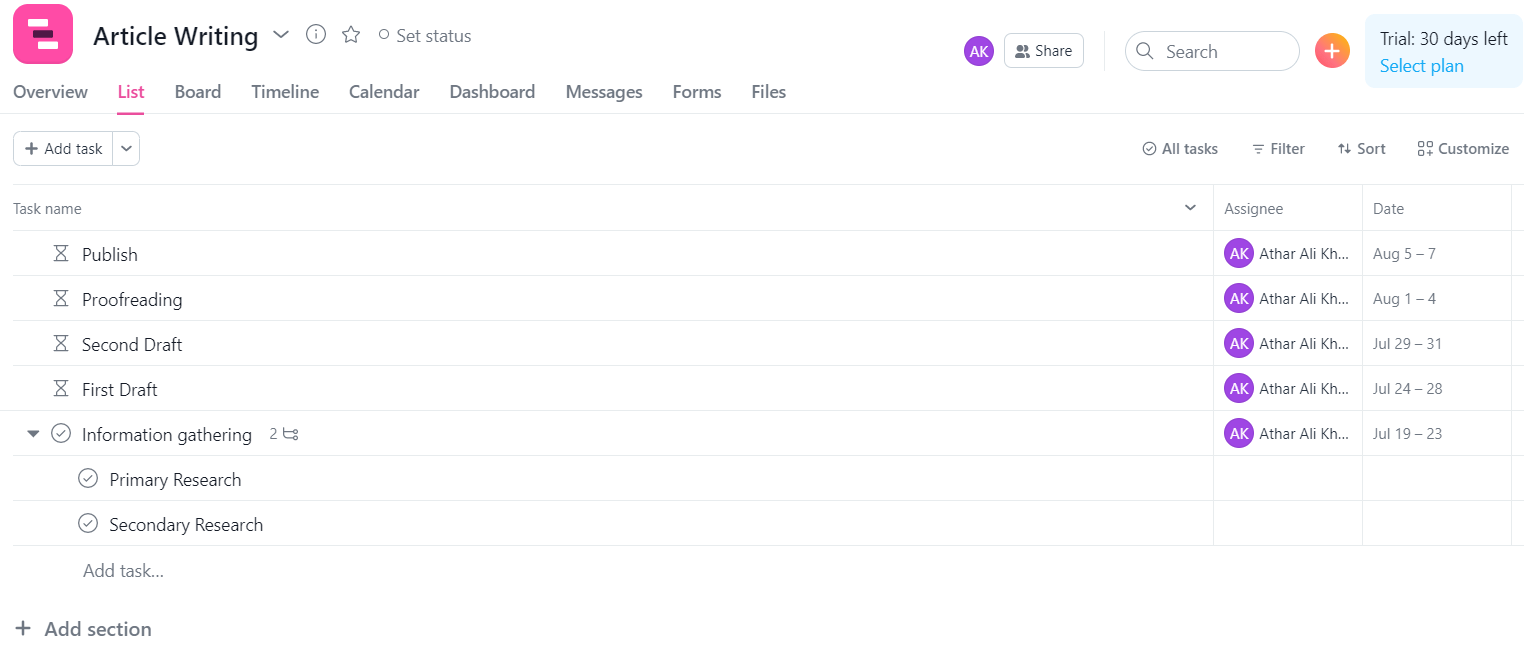
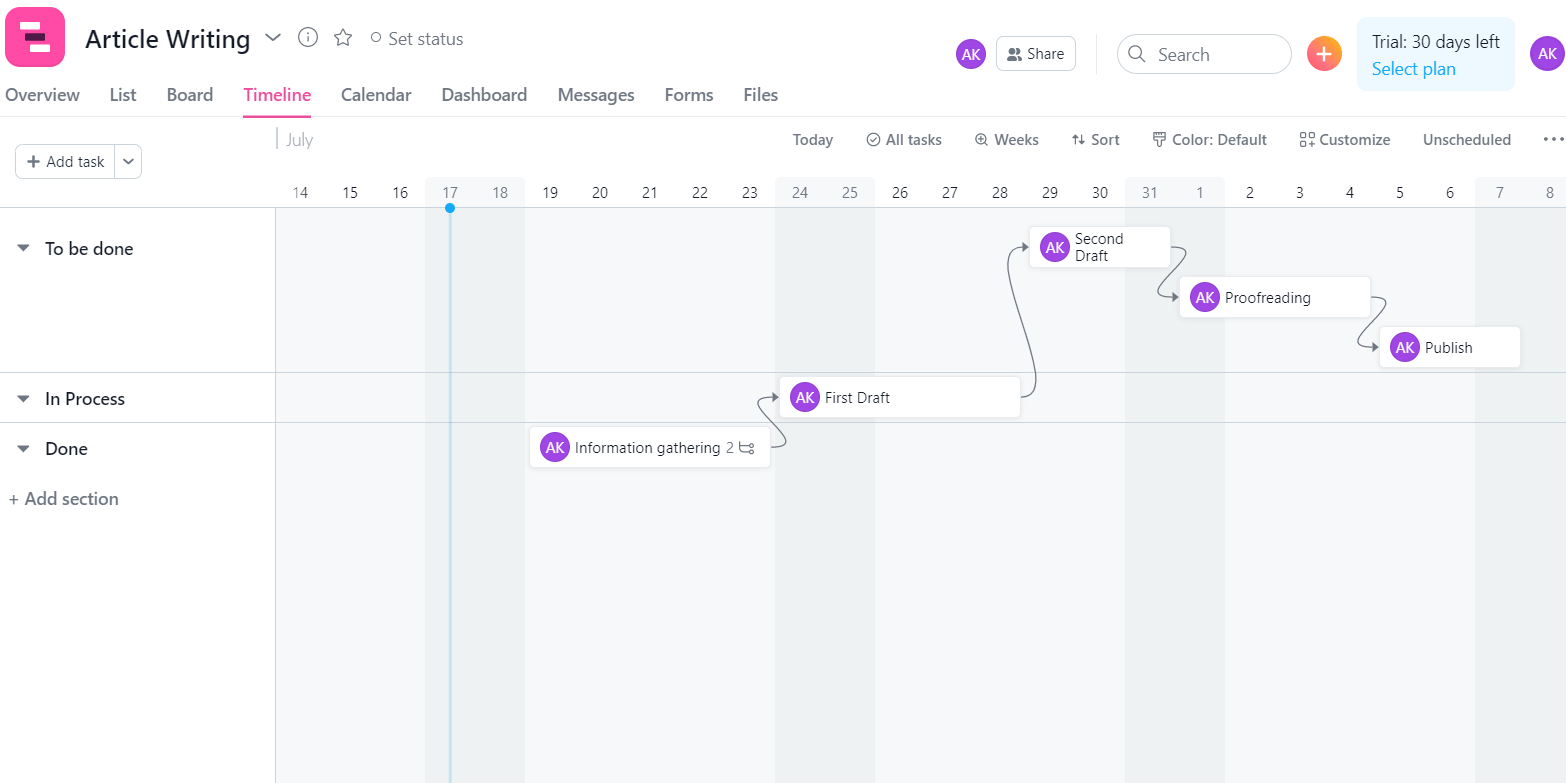
Finalize the project details and set it up the same way as shown above in the first example. The result would look something like this.
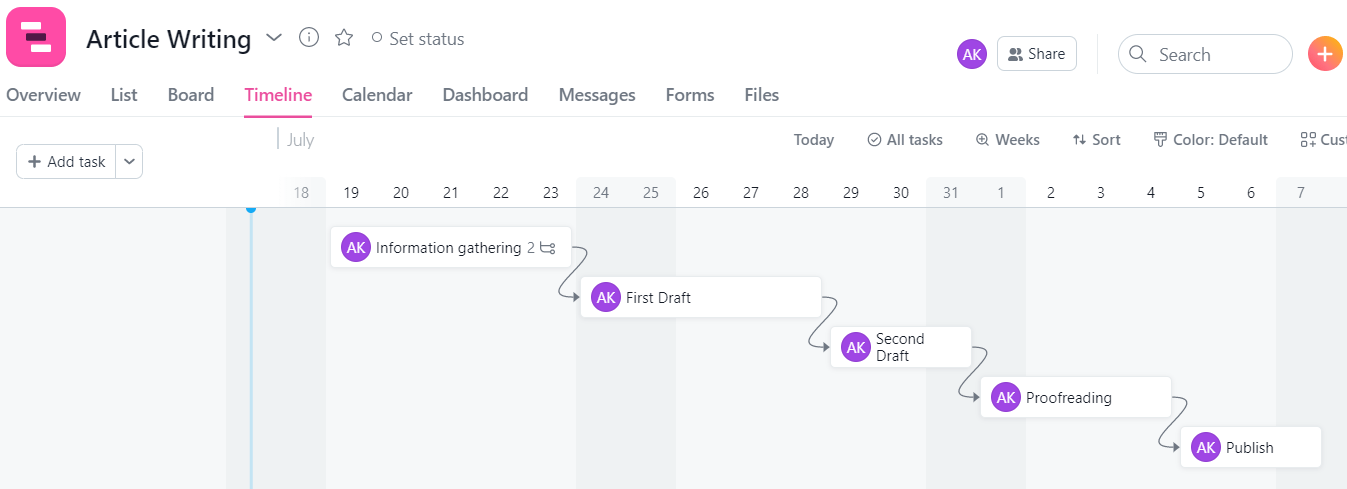
For ease of understanding, the solo article writing project has been broken down into more straightforward steps of information gathering, first draft, second draft, proofreading, and publishing. Each step in the process is dependent on the preceding one. Accordingly, dependencies have been created and can be seen in the Gantt chart.
Since this is a solo project, all the tasks are assigned to the author. If you look closely, the author’s initials show up to the left of every task name. If you upload a profile picture, Asana will show that instead of your initials next to the tasks assigned to you. The same applies to any tasks you assign to your team members.
Experienced project managers already know how to break down their projects into smaller tasks, milestones, and key deliverables. What Asana Gantt charts excel at is illustrating the flow of events from one task to another, one stakeholder to another.
How to Get Started With Asana Gantt Charts
To make your first Gantt chart in Asana, you’d first need to create an account.
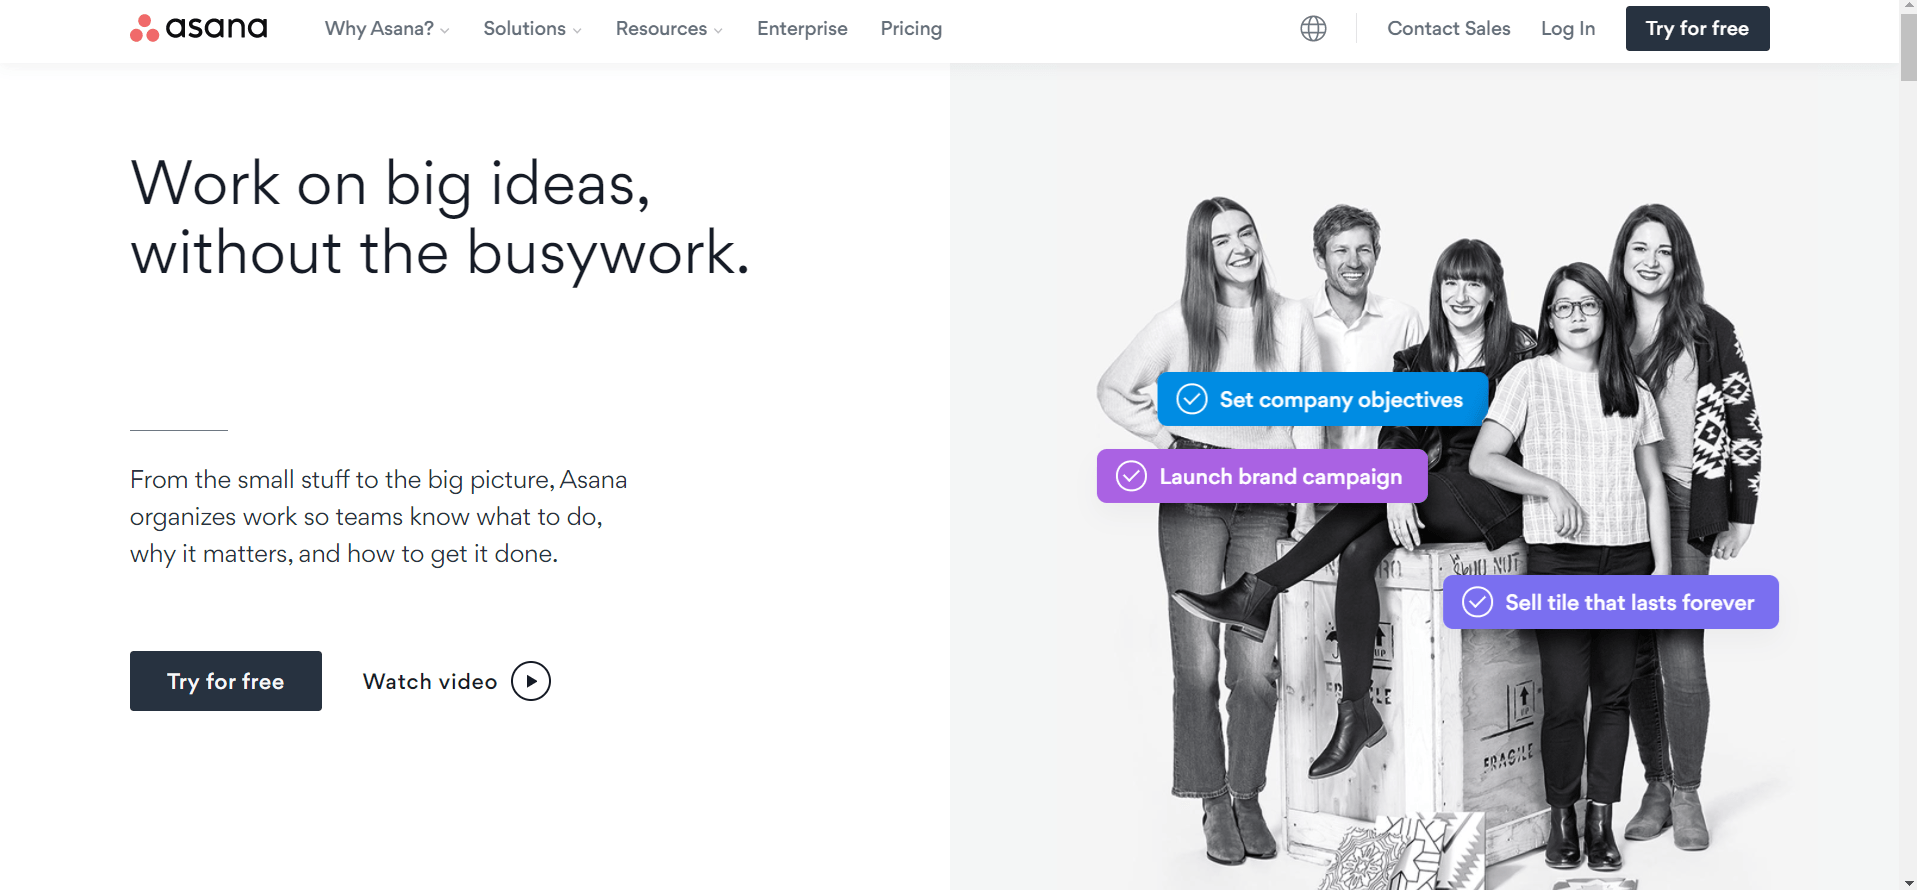
Step 1
Go to asana.com to sign up for an account.
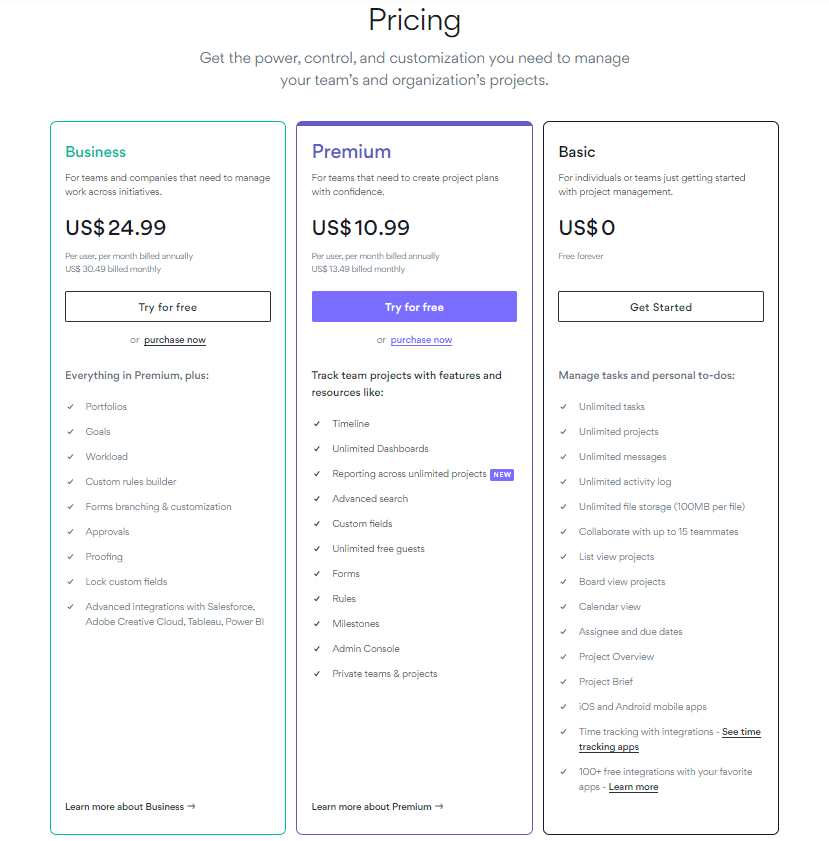
Step 2
Select the Premium plan from the Pricing page because the Timeline/Gantt chart feature is only available when you’re a premium customer.
Step 3
Enter your email and verify your account. If you don’t receive the verification email, check your Spam mail or just have Asana resend the email using the button provided on the screen.
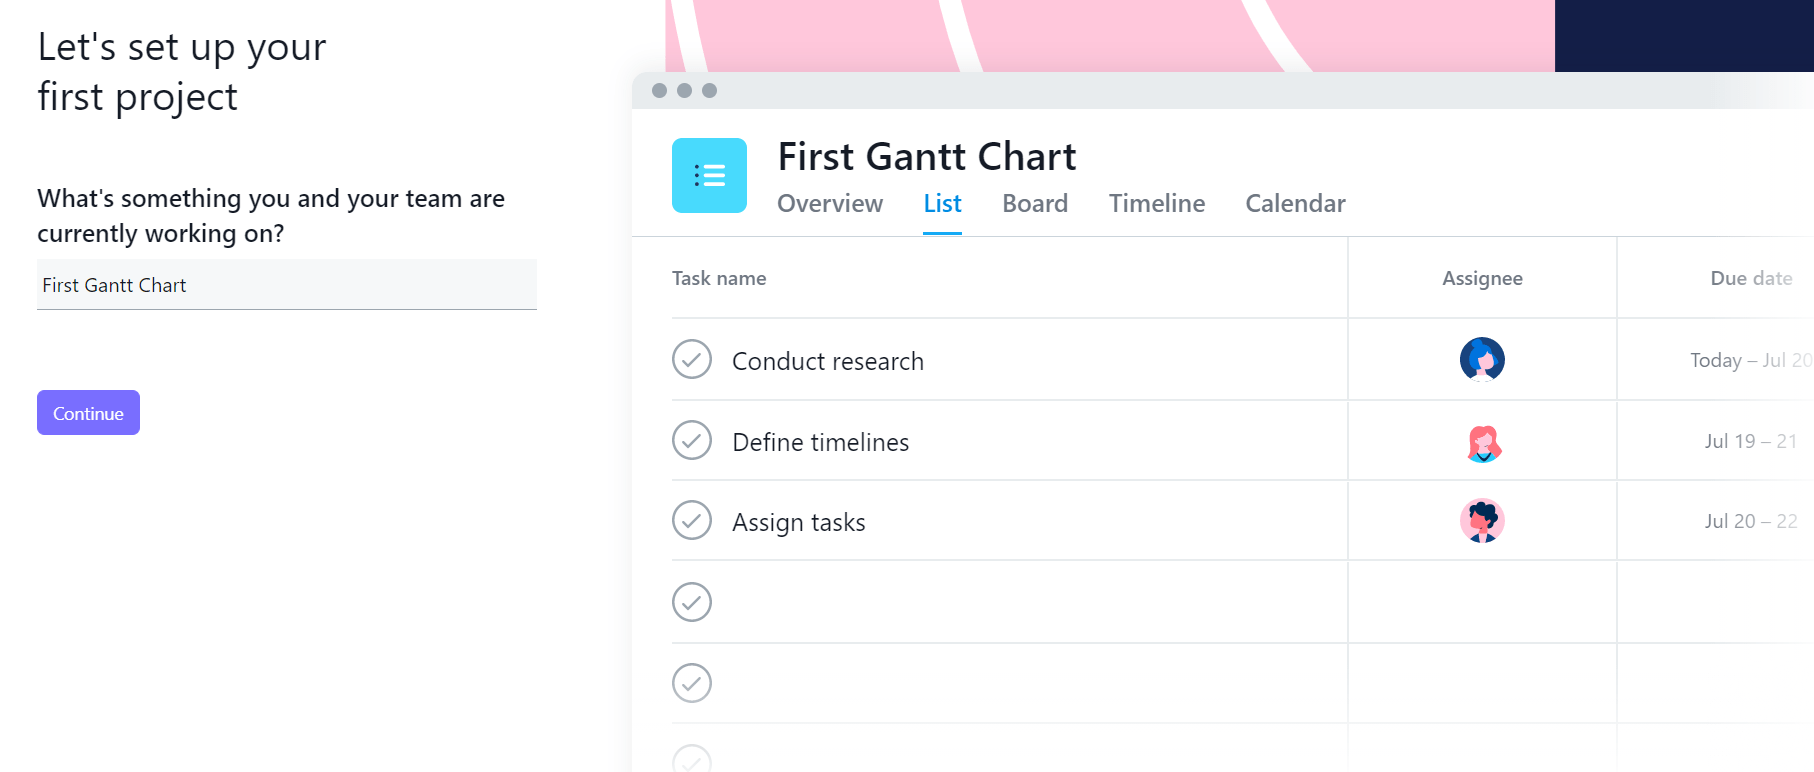
Step 4
Describe the nature of your project and select a name for it. At this stage, the choices you make help Asana determine the default view for your project. For example, your project can be viewed as a list, board, Timeline/Gantt chart, or calendar.
No matter what the default view for your project is, you can always choose a different view at any time from your project page.
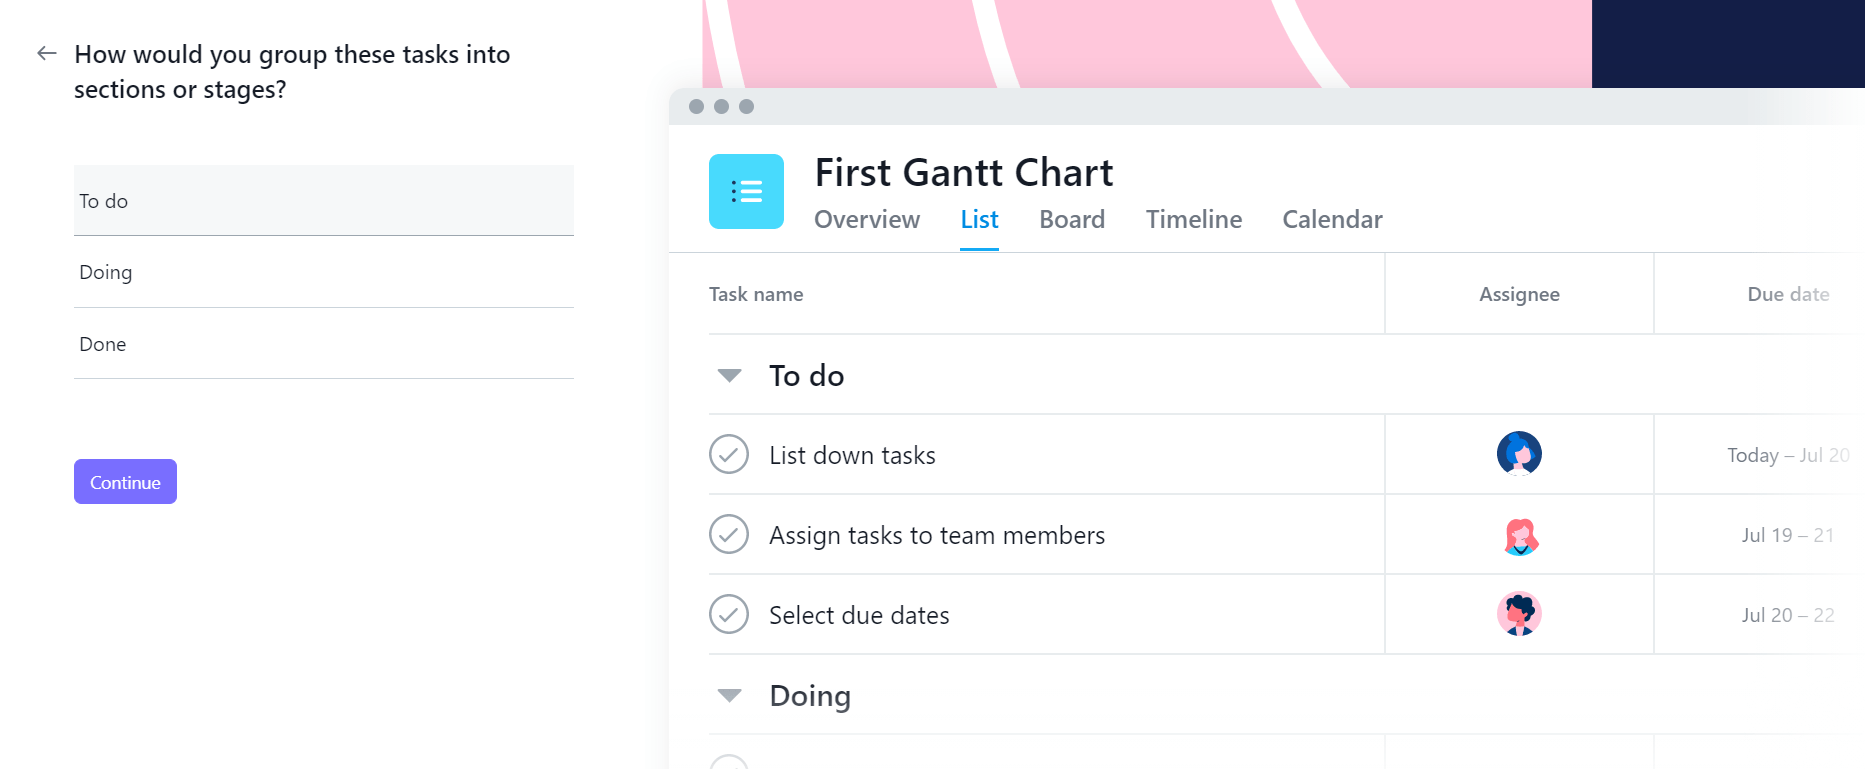
Step 5
After you name your project, choose how you would like your task list to be organized. Typically, this is different variations of To do, In Process, and Done.
Step 6
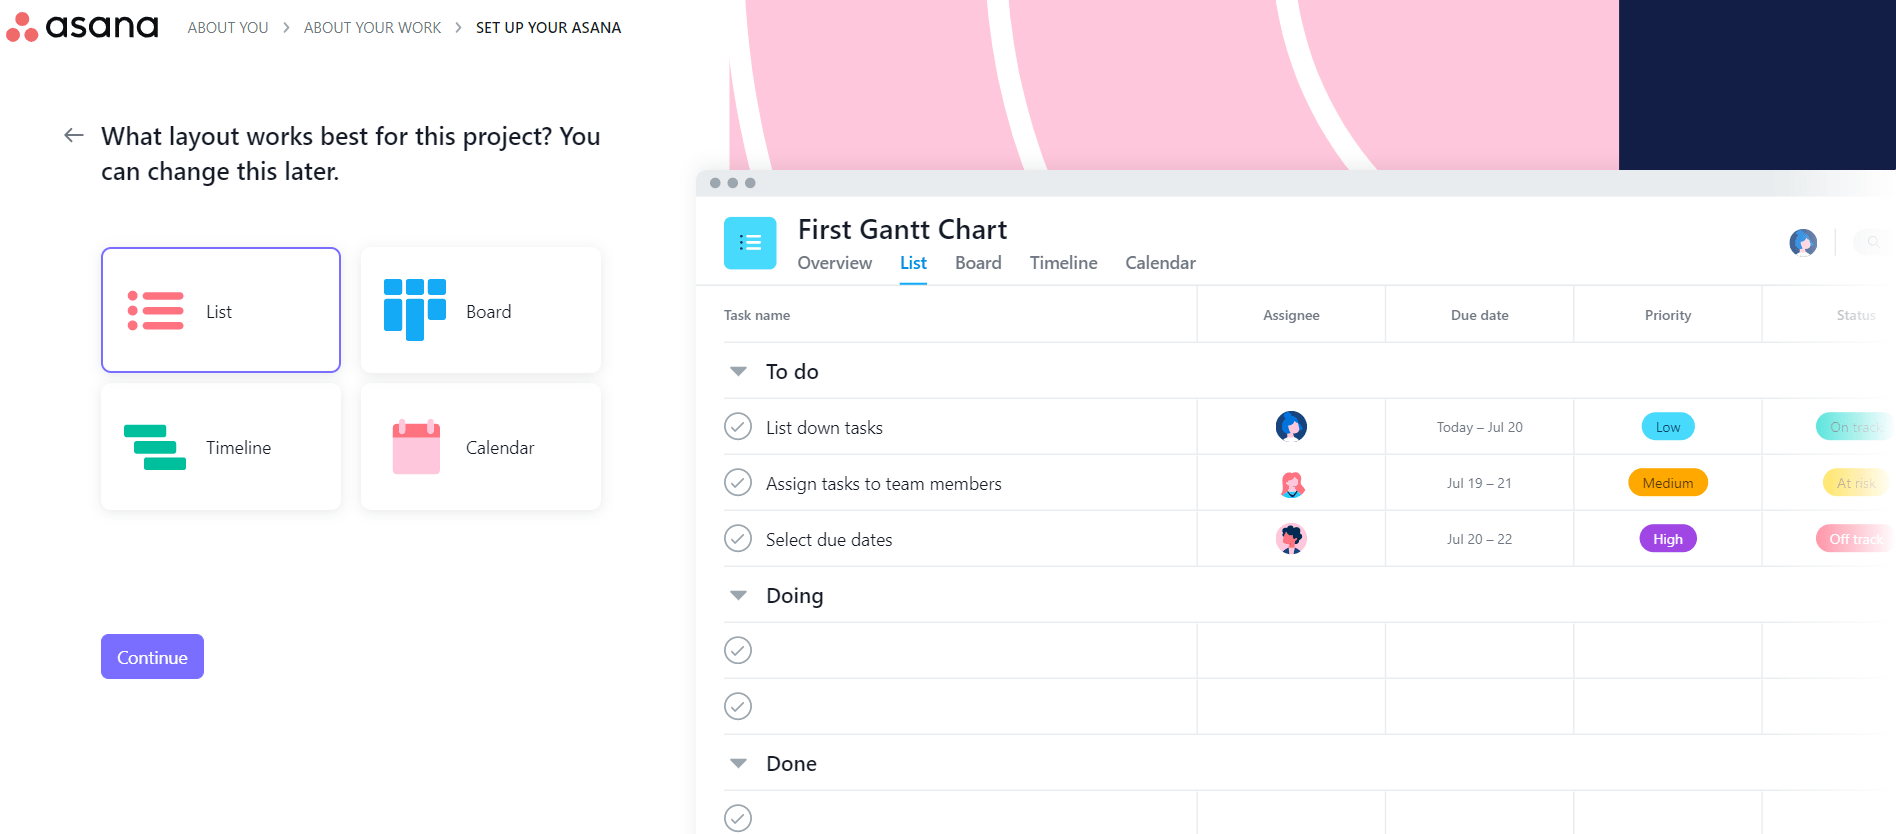
Select your default project view. The view you choose here would be the first layout you’d see when selecting this project the next time. However, you can choose any layout once you’re inside the project. Since we’re creating our first Gantt chart, we’ll be selecting the Timeline layout.
Step 7
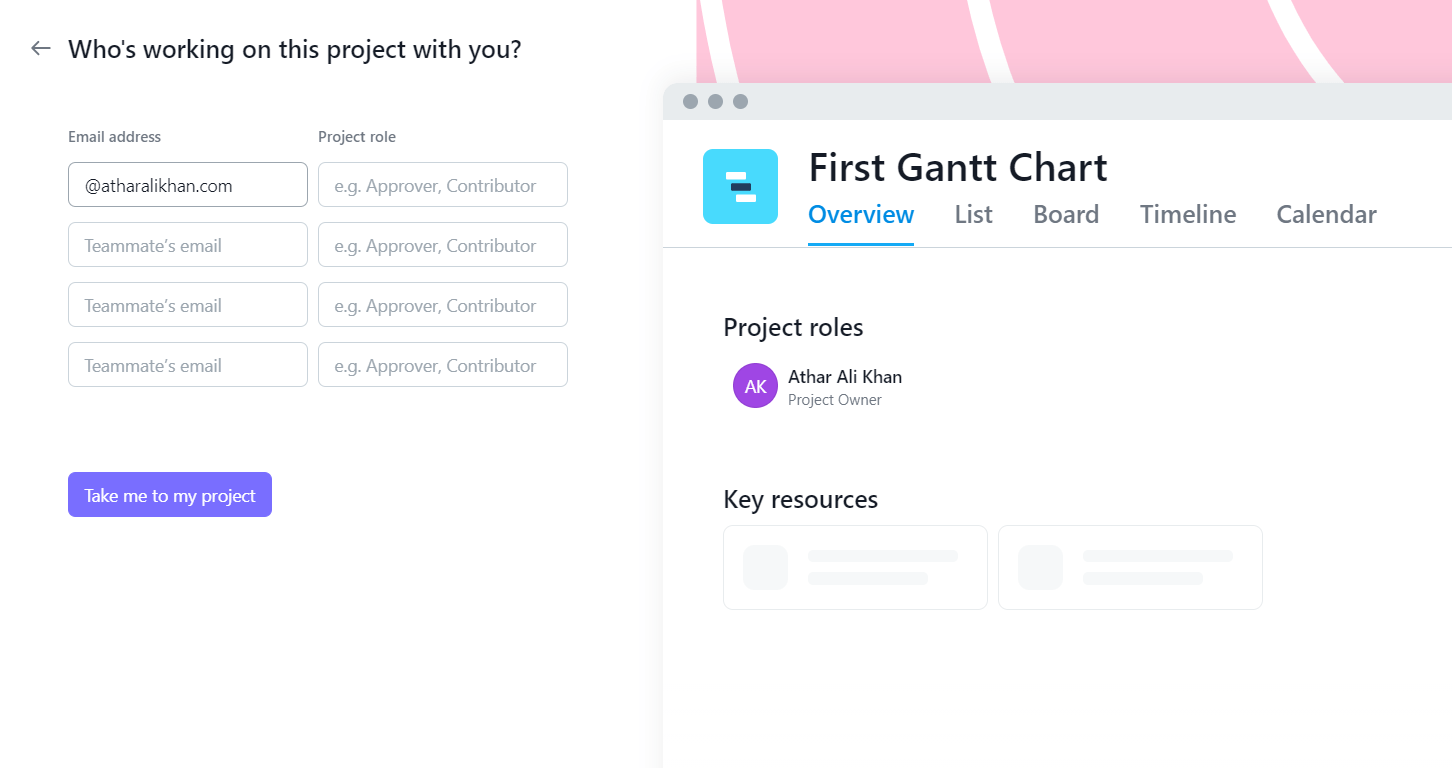
Add team members, if any. At this stage, you’d enter the emails of your team members that you would like to work with. You can also define their roles. However, these are only for your ease of use and don’t impact how your project functions inside Asana. If working on your own without any team members, you can skip this by clicking Take me to my project.
That’s it. You’re in. At this point, your 30-day trial begins.
Step 8
The project opens up in Overview. Click Timeline to view your Gantt chart. Notice how the tasks you listed earlier have automatically been arranged into a Timeline.